NQ Overnight Returns: Historical Drift, Execution Costs and Capital Requirements
An NQ overnight-return study covering 2010–2025, with MNQ execution, risk and capital estimates. The selected rules failed internal validation; their partial 2026 results do not establish a stable net edge.
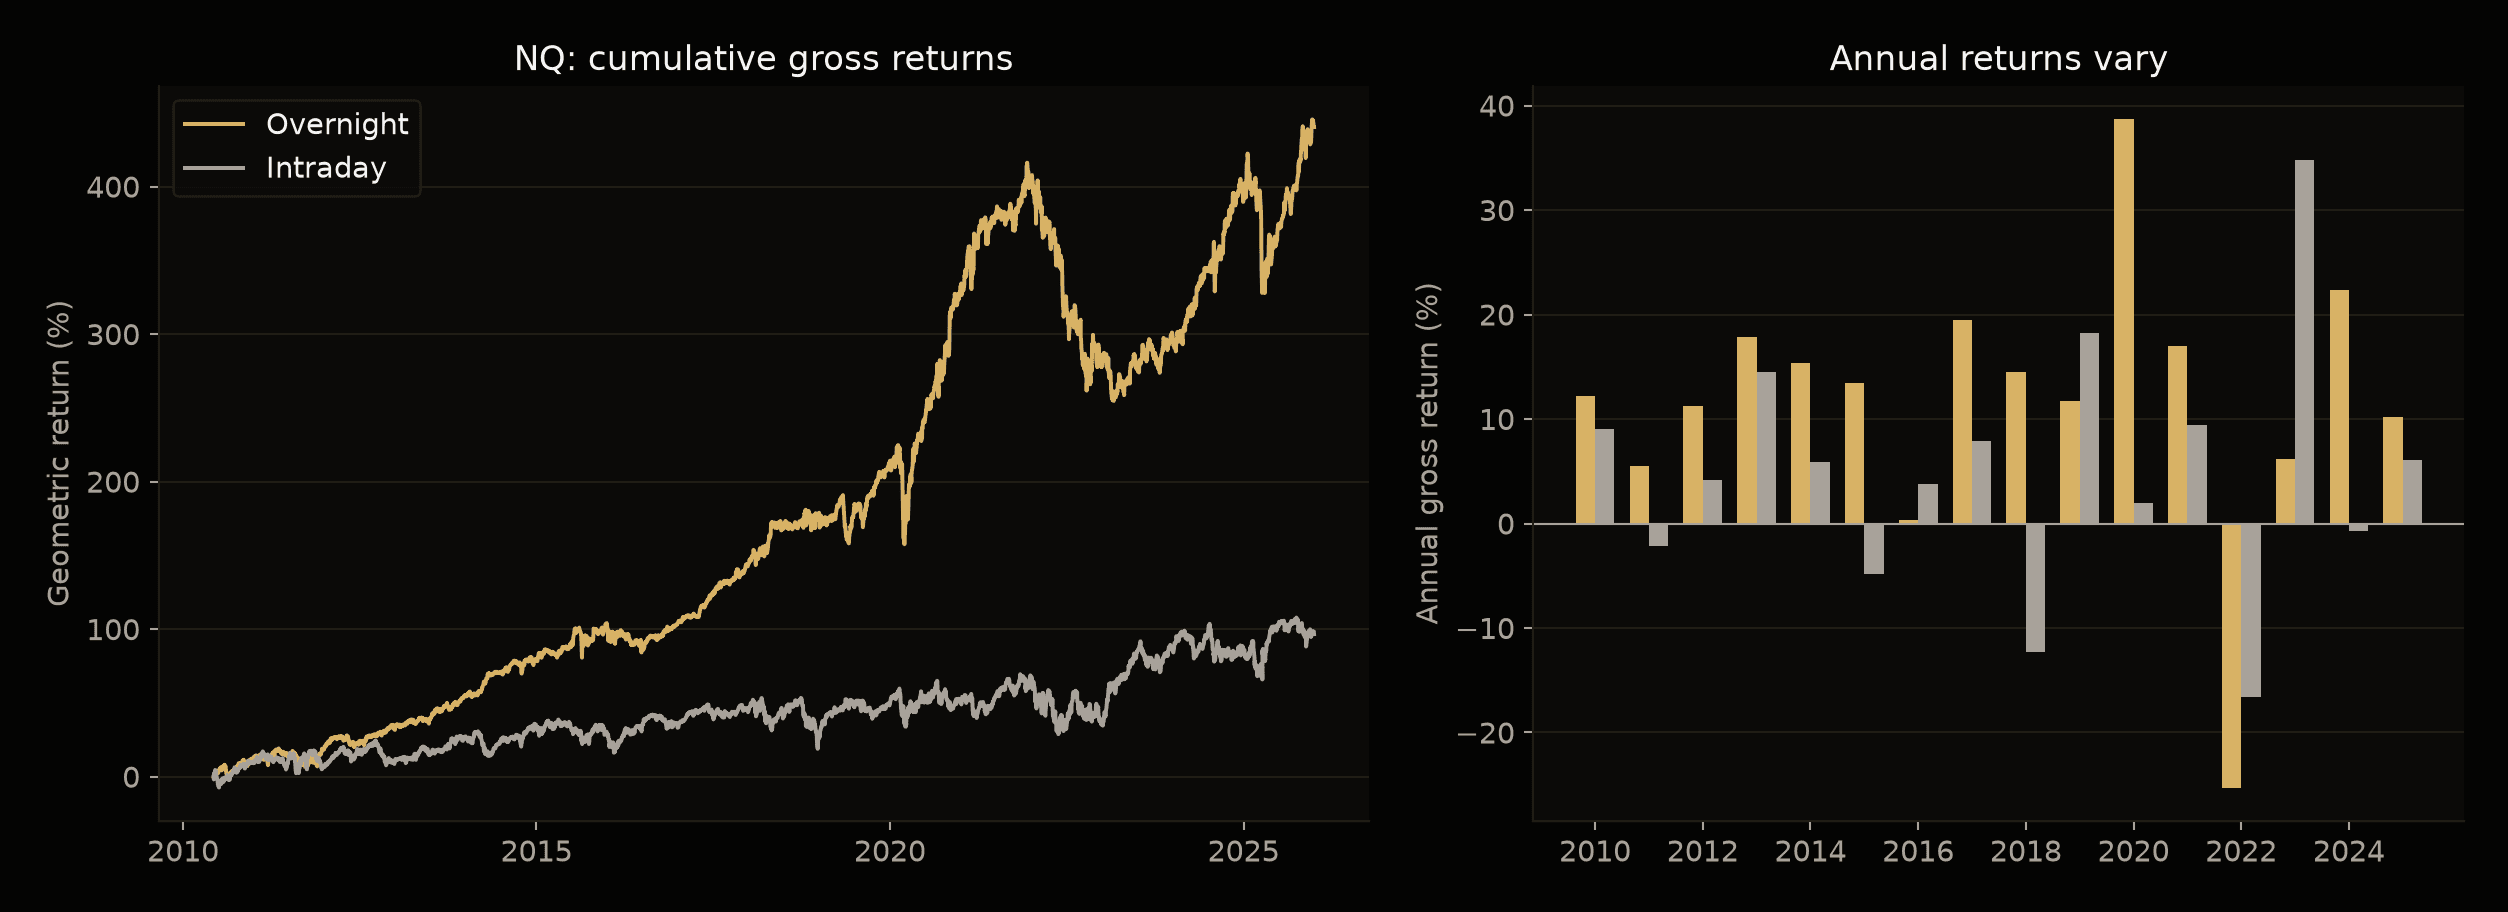
Table of contents
- The paper and the question we tested
- Data and the chronological split
- The price pattern is not an account return
- Execution and costs
- Filter selection
- Stops and scheduled exits
- Volatility-based position size
- Internal validation
- Different outcomes in 2021, 2022 and 2023
- Drawdown after accumulated profits
- The frozen rules in partial 2026
- Funding and capital for a 20% drawdown limit
- What the evidence supports
- Limitations
- Sources and further reading
Between June 2010 and December 2025, compounded gross NQ overnight returns reached 440.35%, compared with 96.62% during the regular session. The long historical sample contains a positive overnight drift. Turning that observation into an executable strategy is a separate question.
We reconstructed the research using only pre-2026 prices to select rules and estimate their risk. Both selected rules failed internal validation in 2023–2025. One became profitable again in the partial 2026 sample, but its uncertainty interval still includes losses. The study supports the historical price pattern; it does not yet establish a stable edge after trading costs.
The paper and the question we tested
The starting point is Strikingly Suspicious Overnight and Intraday Returns, by Bruce Knuteson (2020). The author separates close-to-next-open returns from open-to-close returns. His Nasdaq Composite chart shows approximately +3,402% overnight and −30% intraday from 1990 through September 2020.
We study Nasdaq-100 futures, a different instrument over a different period. We do not test the author's proposed manipulation explanation: open, high, low and close prices cannot identify who traded or why. The paper itself notes that the overnight/intraday divergence in the US indices changed after 2008.
Our practical question is whether a rule known before entry can buy after the cash close and sell after the next cash open, allowing for execution delays, costs, whole contracts and sufficient capital to hold the position.
Data and the chronological split
The historical prices came from Databento, using one-minute NQ and MNQ volume-based continuous futures series from CME Globex. These series retain the original contract prices without back-adjustment. We preserve the identifier of the underlying dated contract, rather than treating a rollover price jump as a market return.
The descriptive NQ sample contains 5,263,568 one-minute bars from 7 June 2010 through 31 December 2025. Of 3,918 cash-session calendar dates, 3,842 have valid prices for both parts of the day without crossing contracts. Missing bars are not filled with invented prices. The split uses bar-opening prices at the scheduled cash open and close, not equity auction execution prices.
For micro execution, we use 2,345,190 actual MNQ bars through 2025. MNQ began trading on 6 May 2019; we do not simulate a micro before it existed. Each MNQ index point is worth USD 2 per contract.
Filters, exits and position size were selected using 2019–2022 entries whose outcomes were known by the end of 2022. The selected rules were then evaluated in 2023–2025 without reselection. Capital scenarios were calculated from closed outcomes available through 2025, and the specification was frozen before the new calculation read the 2026 price files. A night crossing a partition cannot contribute an outcome that was not yet known at that cutoff.
This prevents the program from selecting a rule based on its 2026 result, but it does not remove prior exposure to that year. The research was conducted in October 2026, after other results from 2026 had already been examined. This is a retrospective, chronologically separated reconstruction, not a live forward test registered in December 2025. The choice of hypotheses was not independent of all earlier research, and internal validation does not make previously examined periods untouched data.
The price pattern is not an account return
These percentages multiply the return factors of each interval. They are neither the profit from holding a fixed number of futures contracts nor the return on an account funded with minimum margin. Overnight and intraday percentages also cannot simply be added to obtain the combined return.
The mean overnight log return is approximately 4.39 basis points per session. Its 95% interval, estimated with blocks of twenty sessions, is 2.13 to 6.48 basis points. The long sample provides more evidence of positive gross drift than a single profitable year would.
It does not establish that overnight returns exceed intraday returns with the same statistical confidence: the interval for their mean difference includes zero. Intraday compounded returns are also positive in this sample. A positive return for bearing market exposure need not translate into an attractive strategy on the capital required to trade it.
Execution and costs
The entry decision is made one minute before the Nasdaq cash market's scheduled close, using information from previous completed sessions. In the operational scenario, the buy uses the first available bar open from one minute after the close, and the sale uses the first available bar open from one minute after the next cash open. The stress scenario delays both endpoints by two minutes. On a normal session these are 16:01 to 09:31 and 16:02 to 09:32, respectively, in New York local time. Early closes use their official schedule.
The dated contract is identified before entry and must remain the same at exit. Because the continuous source does not always retain the outgoing contract during a rollover, we exclude nights overlapping the interval from fourteen days before to three days after each quarterly third Friday. This calendar restriction applies to every variant. It changes the sample and has an opportunity cost; the execution results do not describe every overnight interval in the index.
Execution waits at most five minutes for an eligible bar. An unfilled entry is not a trade. An open position with an unexplained missing exit inside the sample prevents the calculation from completing; it is not silently discarded. A position still awaiting its exit at the data cutoff remains open.
The operational scenario deducts 0.5 points per side and USD 2 in round-trip commissions per micro. Stress uses one point per side and USD 4 in round-trip commissions. At USD 2 per point, total friction relative to the chosen bar prices is USD 4 and USD 8 per round trip, respectively.
We also assume USD 600 in annual fixed expenses, equivalent to USD 50 per month, allocated as 600 / 252 per cash-session calendar date even when no trade is placed. These are explicit cost scenarios, not a quoted broker fee schedule.
Throughout the article, marked drawdown means a fall from a previous account-equity peak that includes unrealized losses while a position is open. It is not limited to completed trades. The calculation compares previously observed minute closes with subsequent bar lows; it does not invent the sequence of highs and lows inside a minute.
Filter selection
We compared ten options: all executable nights; positive twenty- or sixty-session trend; volatility below Q65, Q75 or Q85; no Friday entries; and three simple combinations of trend with volatility or Friday exclusion.
Trend sums returns from previous complete sessions without counting contract-switch jumps as gains. Volatility is the average percentage high-to-low range of the previous twenty regular sessions. Q75 compares that average with the 75th percentile of its earlier observations, using up to 252 observations and requiring at least 126 valid ones. The entry day's range is not yet known at the decision time and is not used.
With one micro and stress costs, selected development results were:
| Filter | Trades | Net profit, 2019–2022 | Marked drawdown |
|---|---|---|---|
| No filter | 729 | −USD 422 | USD 7,076 |
| Twenty-session trend | 442 | USD 575 | USD 3,187 |
| Volatility Q75 | 506 | USD 125 | USD 4,192 |
| No Friday entries | 592 | USD 861 | USD 4,560 |
| Twenty-session trend + Q75 | 351 | USD 9 | USD 2,044 |
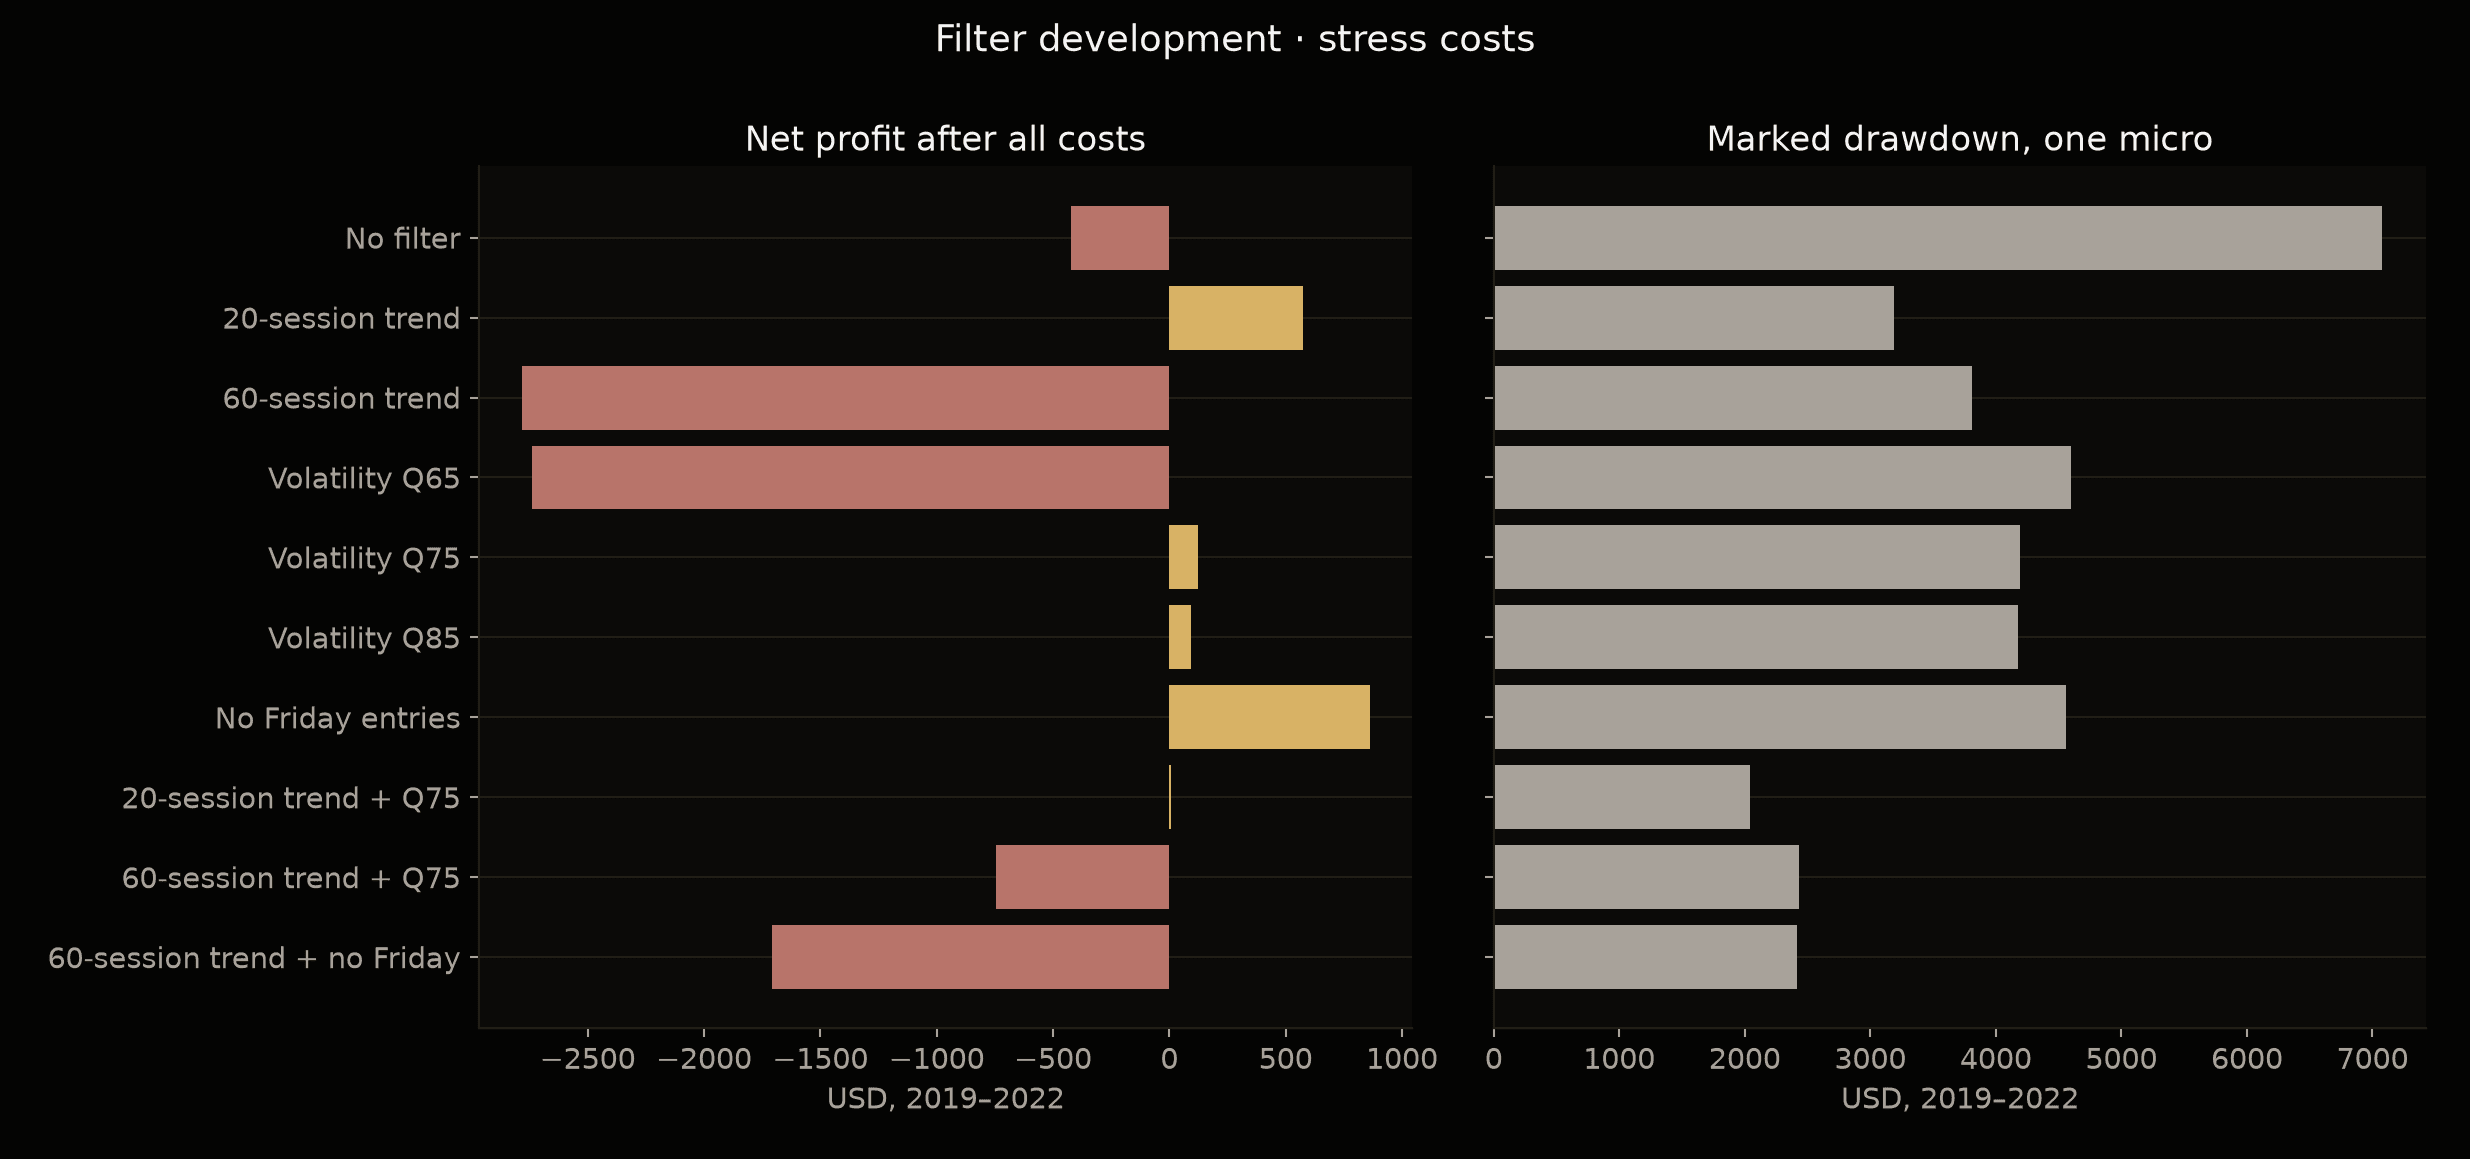
Twenty-session trend + Q75 required the least historical funding during development. Excluding Friday entries produced the highest profit-to-drawdown ratio among the economically eligible options. We retained both rules for these separate objectives. The first rule's USD 9 net profit leaves little allowance for additional costs. None of the ten filters established a positive mean after correction for comparisons within that family.
Eligibility required at least 200 trades, positive net profit under stress, and retention of at least 70% of the unfiltered control's profit when that control was positive. These criteria were fixed before this calculation; they are research choices, not properties of the market.
Some alternatives were profitable over the full pre-2026 sample: Q75 and Q85 alone produced approximately USD 267 and USD 1,674 net under stress. Those are descriptive results from the registered family. The protocol selects in development and evaluates later; it does not replace a failed rule with whichever alternative wins across the combined sample.
Stops and scheduled exits
For each selected filter, we tested exit at the next cash open; stops of 125 or 250 points; stops of 0.25, 0.5 or one previous average range; breakeven; and trailing. A moving stop updates only after the relevant bar completes. If the next bar opens below the stop, the exit uses that worse opening price with slippage, not an assumed fill at the stop level.
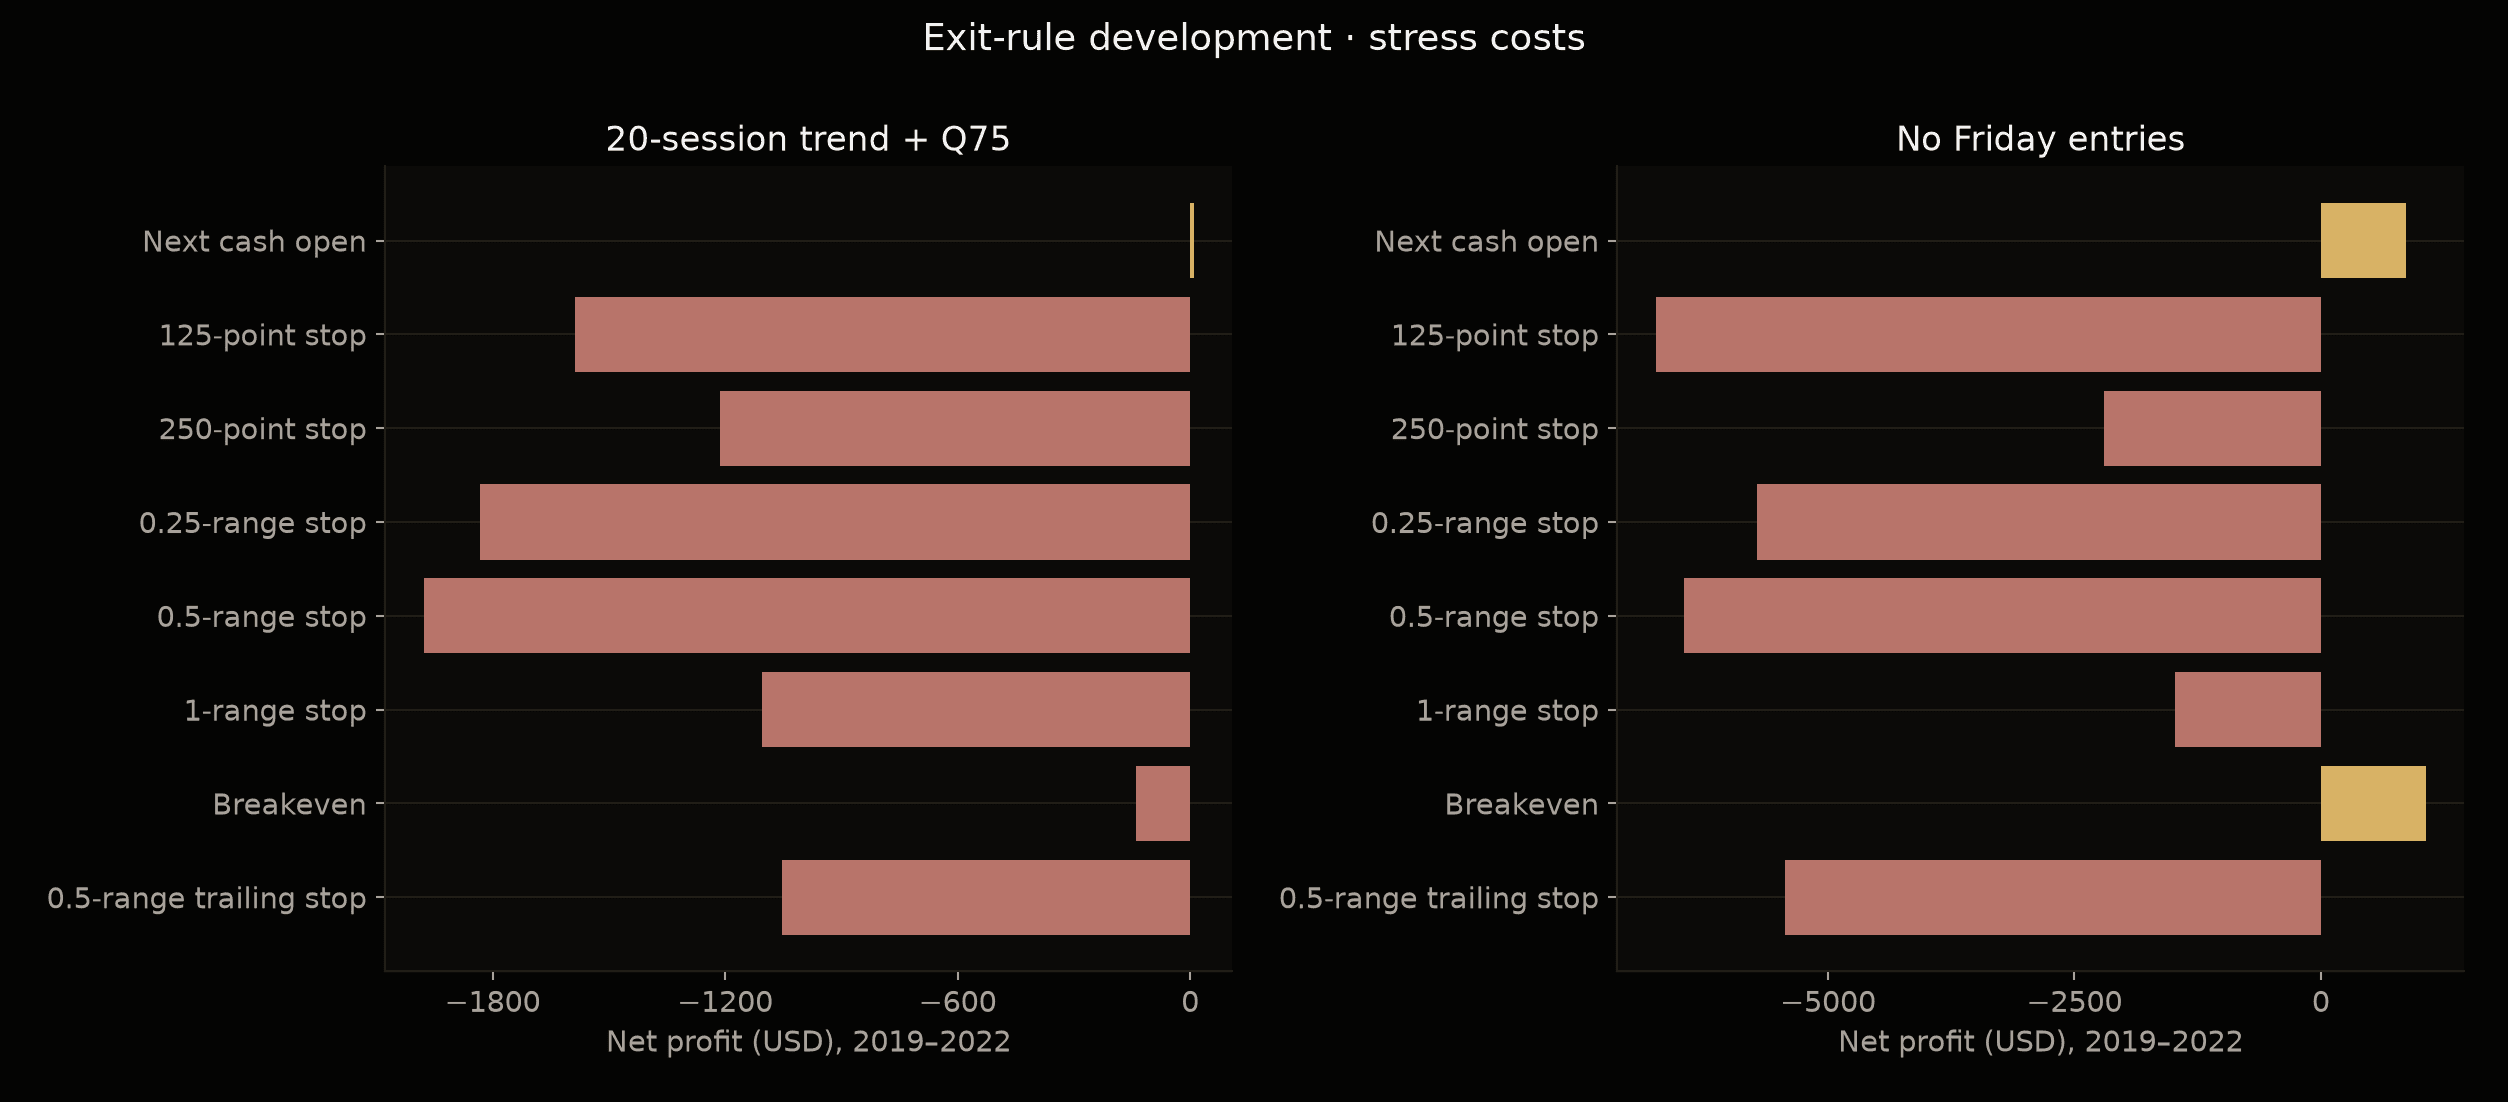
Many stops reduced profit. Breakeven was an exception for the no-Friday filter: net profit improved from approximately USD 861 to USD 1,067, while drawdown fell from USD 4,560 to USD 3,948. The reduction was about 13.4%, below the previously specified 15% requirement for replacing the exit. We therefore retained the scheduled next-open exit. This does not show that all stops are useless; none of these eight exits met the registered replacement criterion.
Both final rules enter a selected overnight interval and exit after the next cash open, with the stated delays. Neither has a take-profit order or a price stop. Capital must support adverse movement while the position remains open.
Volatility-based position size
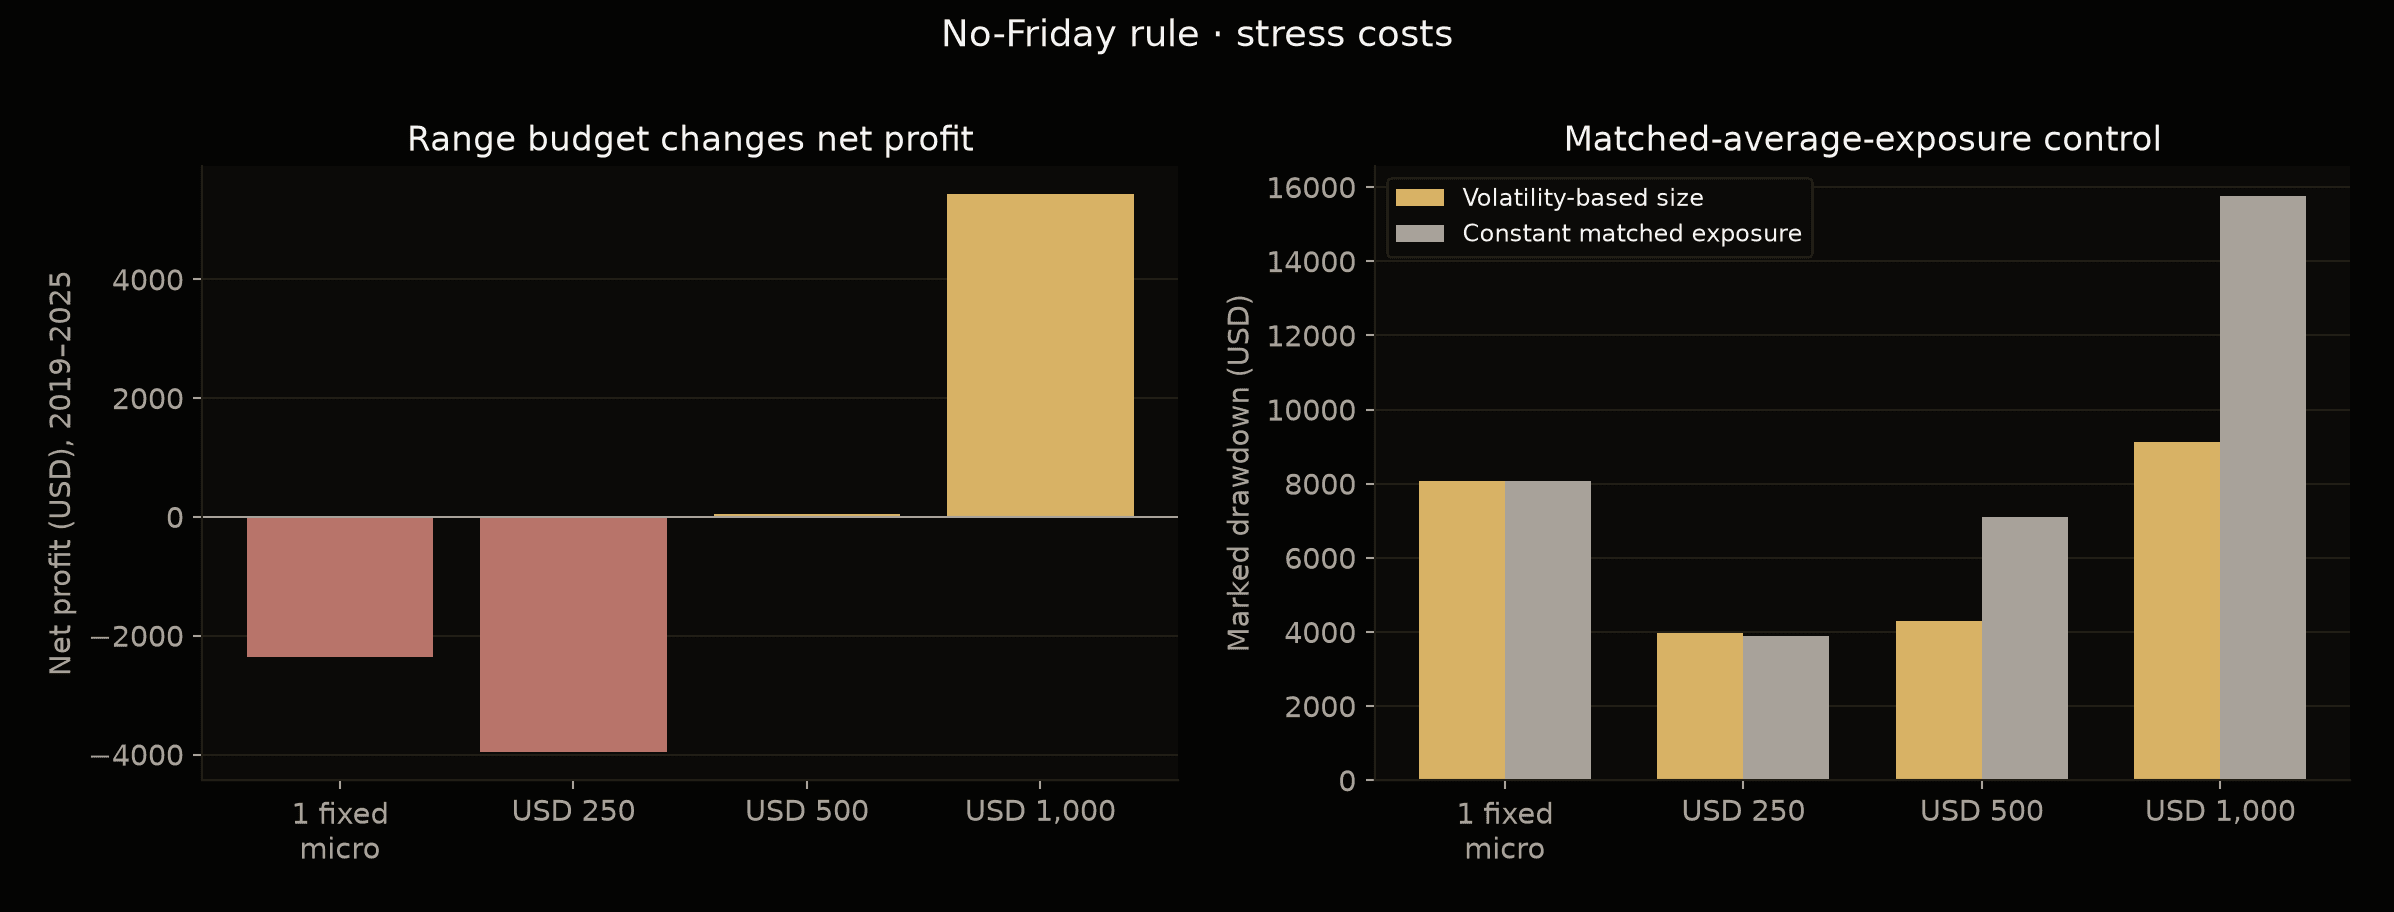
Before entry, the average range of the previous twenty sessions is known. We compared range budgets of USD 250, USD 500 and USD 1,000. The number of micros is the integer part of budget / (2 × previous average range in points), capped at five. A result of zero means no trade. The range budget is not a stop or a guaranteed maximum loss.
Whole-contract sizing matters: half an MNQ cannot be held when volatility rises. Reducing a one-micro position means moving to cash; increasing it requires funding another contract.
| Position size | Full-sample net profit | Drawdown | Matched-exposure control drawdown | 2023–2025 validation net profit |
|---|---|---|---|---|
| One fixed micro | −USD 2,356 | USD 8,081 | USD 8,081 | −USD 3,214 |
| USD 250 budget | −USD 3,965 | USD 3,965 | USD 3,906 | −USD 1,788 |
| USD 500 budget | USD 57 | USD 4,308 | USD 7,107 | −USD 19 |
| USD 1,000 budget | USD 5,431 | USD 9,128 | USD 15,768 | −USD 125 |
The USD 500 budget reduces drawdown by about 39% against its matched-average-exposure control. The USD 1,000 budget reduces it by about 42%. These comparisons do not merely contrast a smaller position with a larger one: the timing of position size changes the observed risk.
However, validation net profit is approximately −USD 19 and −USD 125 for those budgets. The full-sample profit of the USD 1,000 budget comes from development, and its mean test does not establish a stable positive expectation.
Funding is a separate constraint. Those budgets required approximately USD 27,304 and USD 35,381 to support their historical quantities and losses, versus USD 9,772 for one fixed micro. Lower drawdown than a matched control does not necessarily mean a smaller initial account.
In development, the USD 1,000 budget earned more but increased absolute drawdown by about 29%, above the 25% acceptance limit. The frozen rules therefore retained one micro. Full-sample sizing comparisons describe registered alternatives; they neither replace the final rules nor introduce additional 2026 tests of those alternatives.
Internal validation
| Rule selected in development | Trades, 2023–2025 | Operational net profit | Stress net profit | Stress drawdown |
|---|---|---|---|---|
| Twenty-session trend + Q75 | 397 | −USD 1,563 | −USD 3,989 | USD 6,260 |
| No Friday entries | 483 | USD 62 | −USD 3,214 | USD 8,048 |
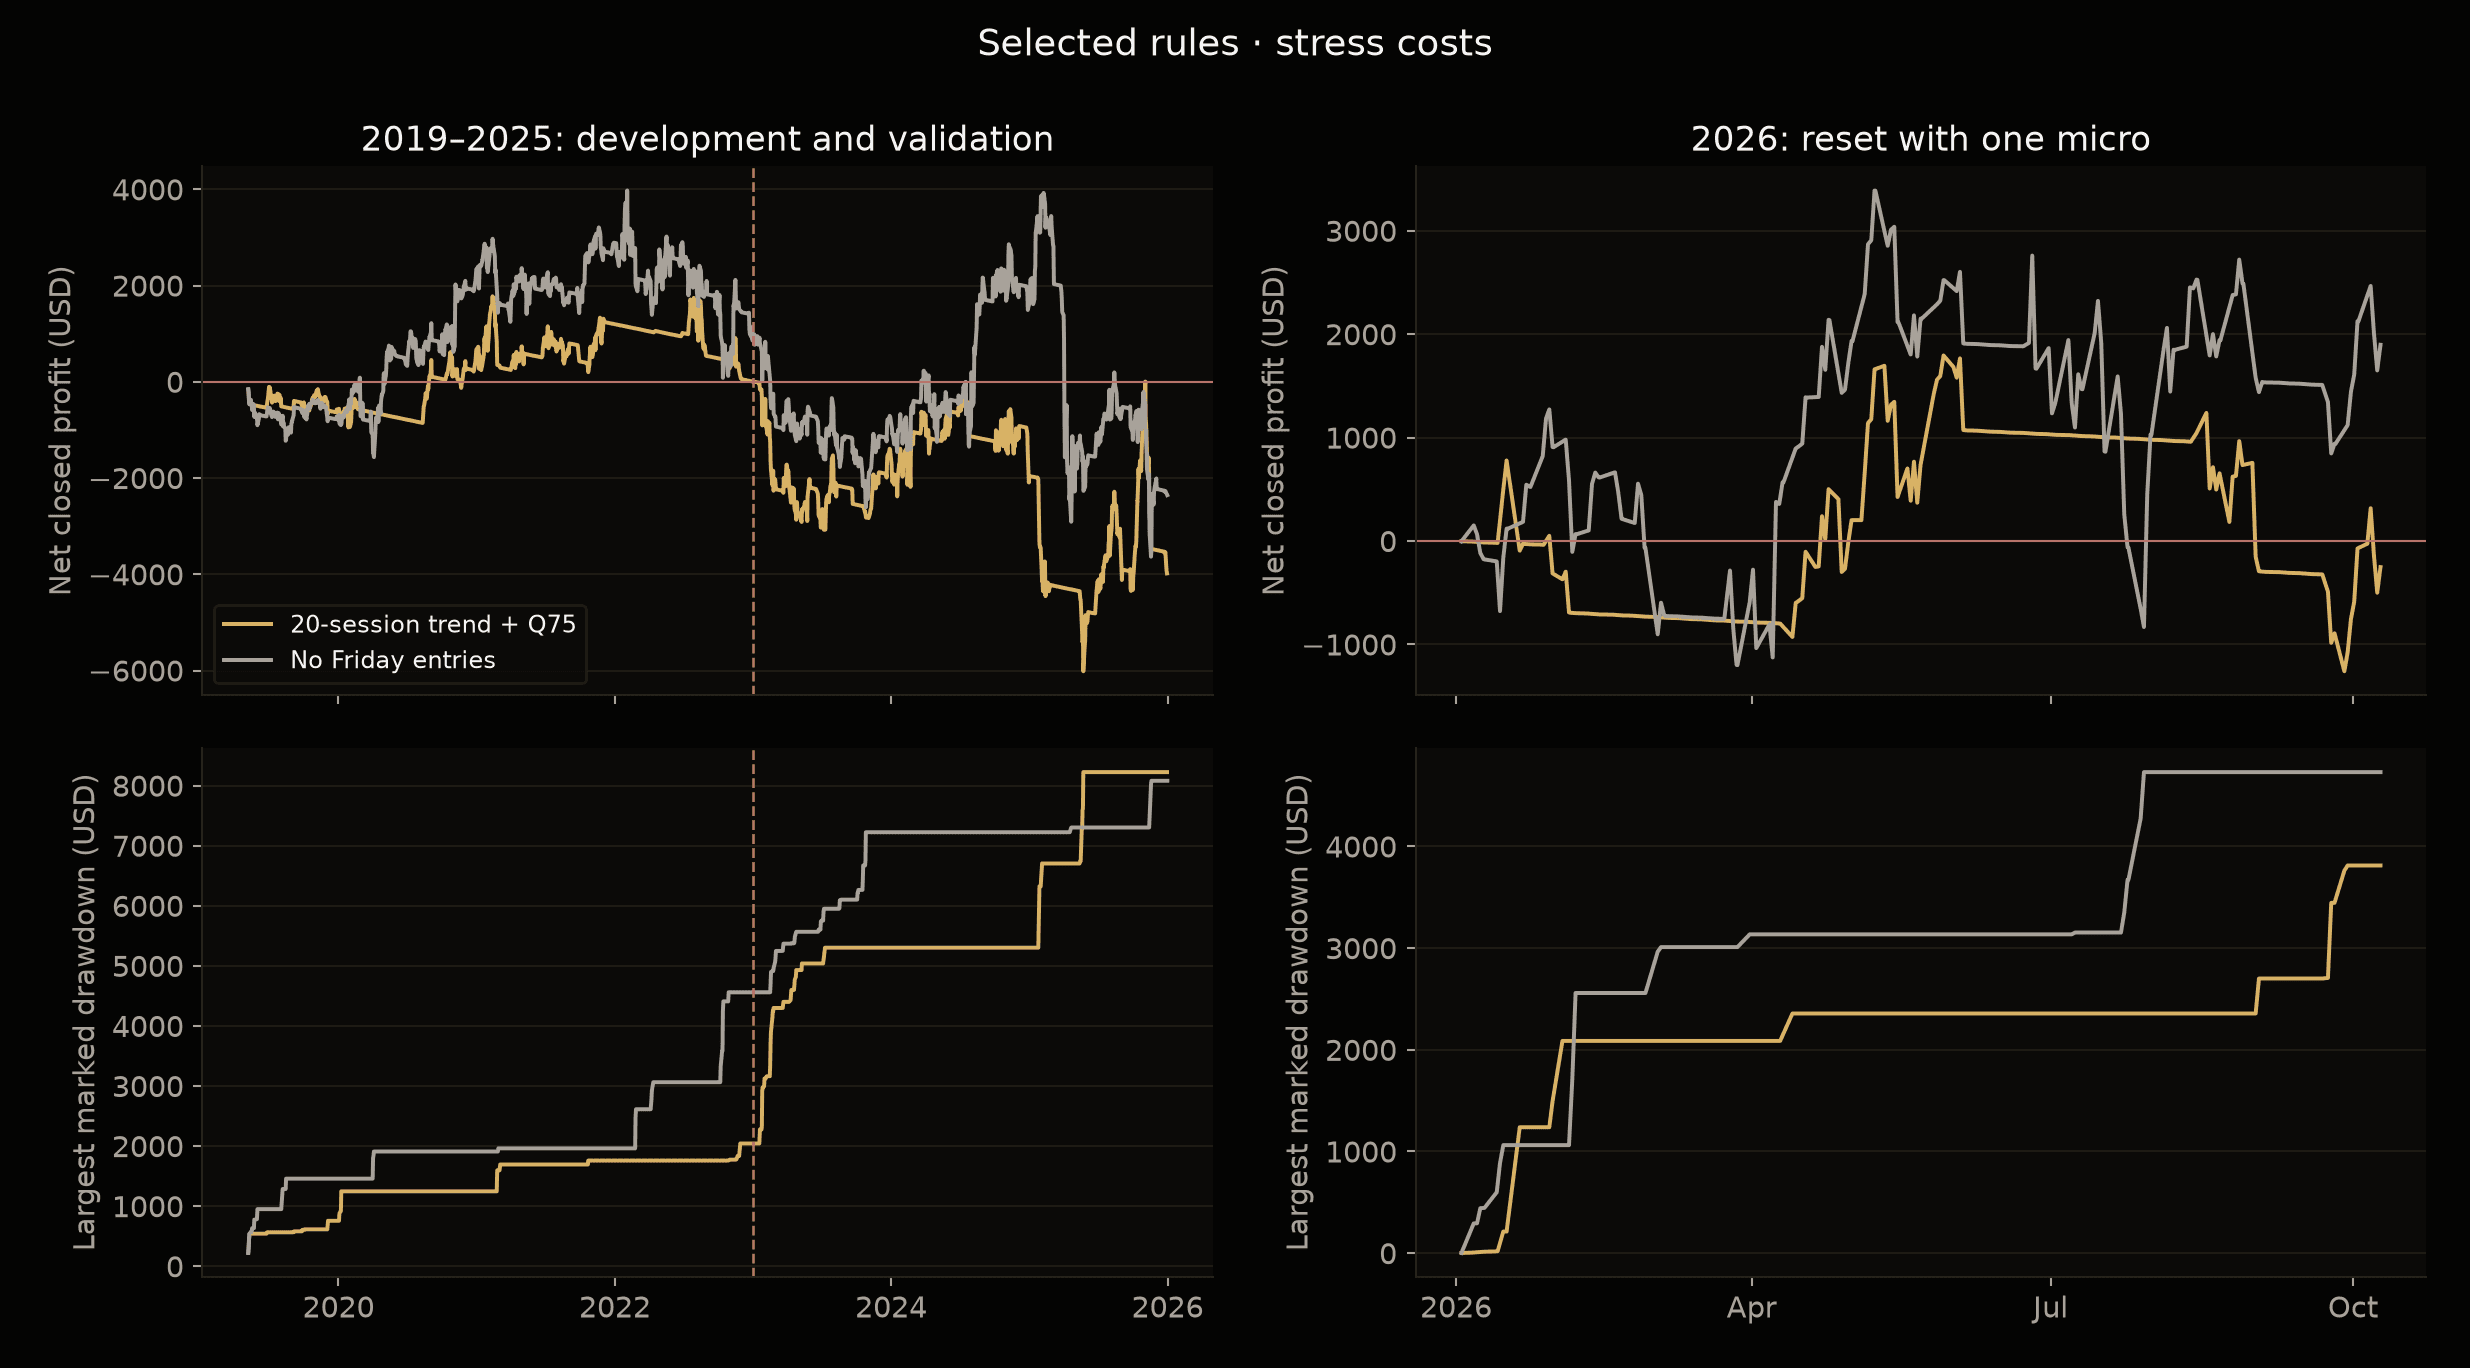
The no-Friday filter earned only USD 62 with operational costs and lost over USD 3,200 under stress. Twenty-session trend + Q75 lost in both scenarios. Neither met the requirements for stress profitability, annual stability and statistical evidence. Before 2026 was evaluated, both were research hypotheses rather than rules approved for live trading under this protocol.
Different outcomes in 2021, 2022 and 2023
Gross NQ overnight returns were approximately +16.96% in 2021, −25.27% in 2022 and +6.15% in 2023. Executable MNQ nights after stress costs were also profitable in 2021. The large annual loss occurred in 2022.
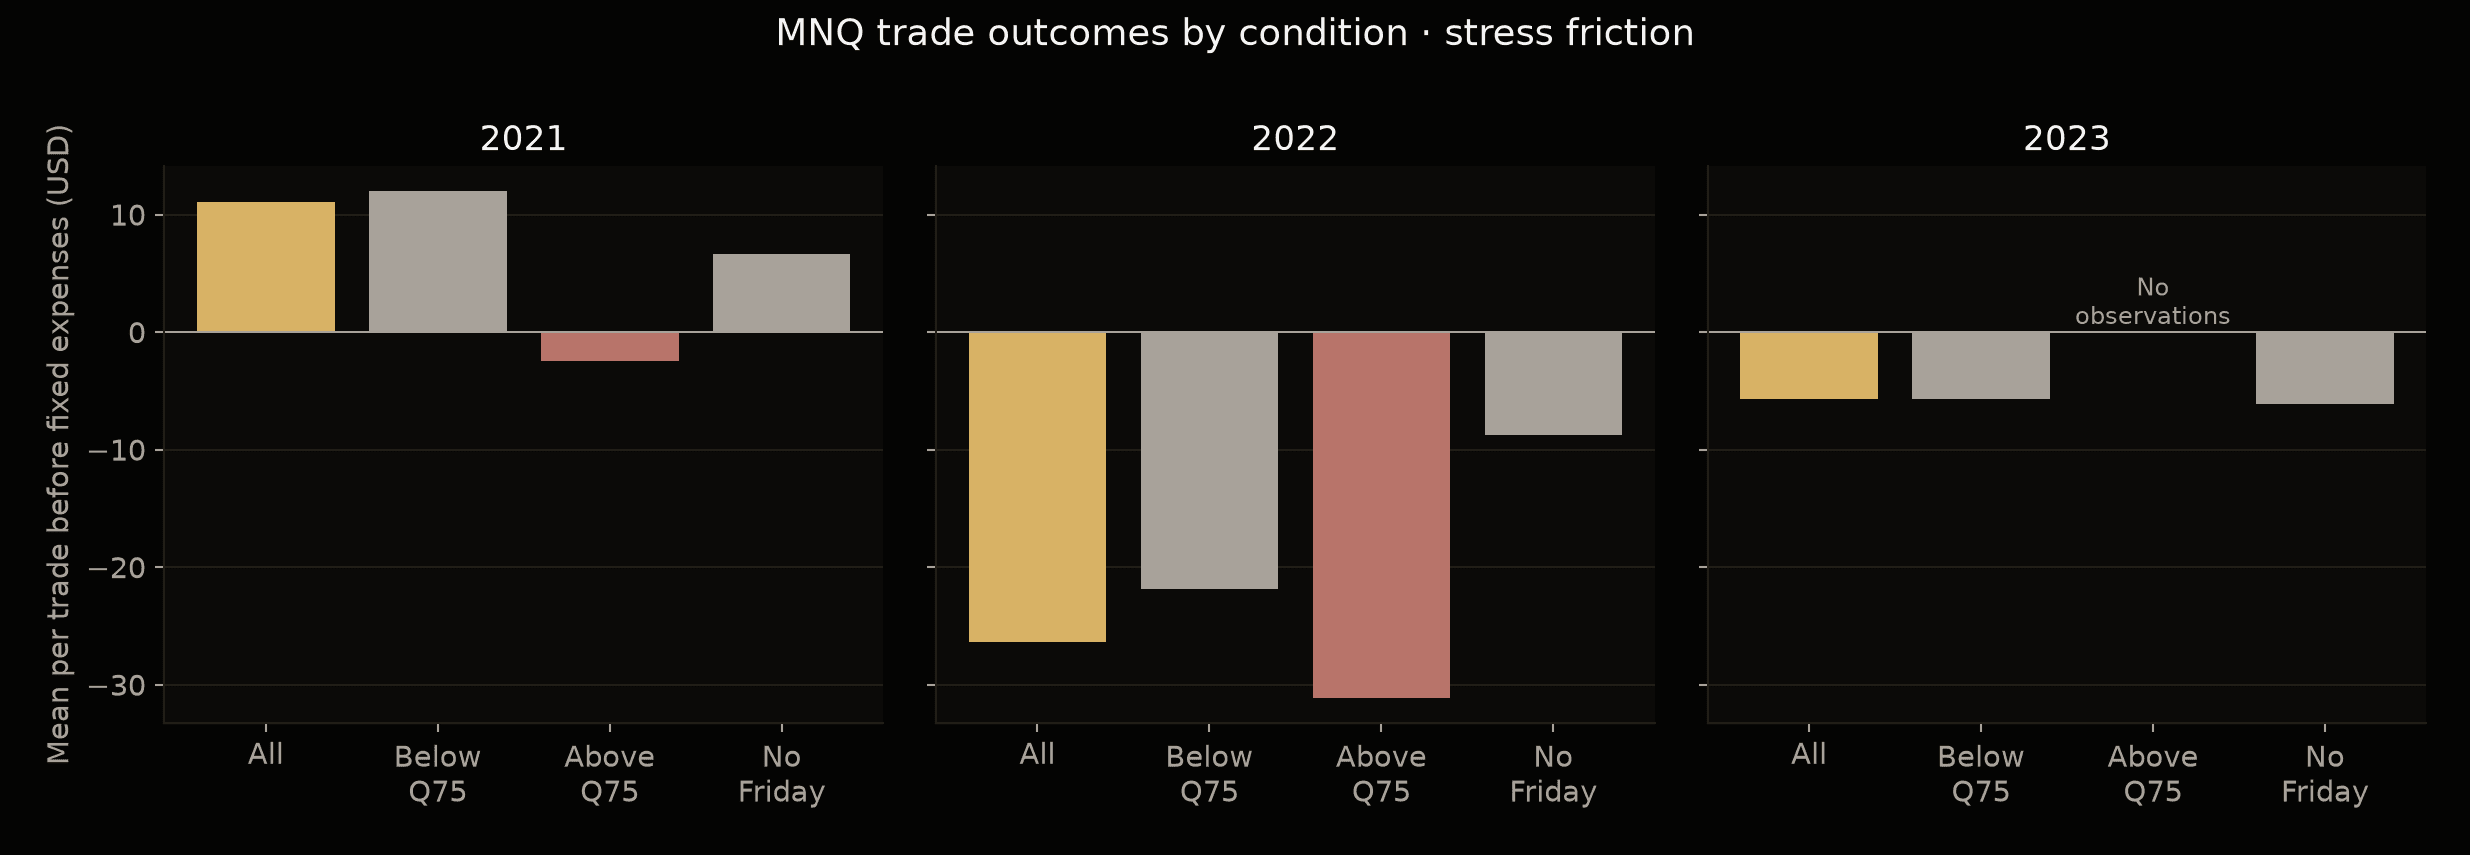
In 2022, both below-Q75 and higher-volatility nights lost money. The higher-volatility group lost about USD 31 per trade, versus USD 22 for the lower-volatility group. Excluding the first group reduced exposure to losses but did not make the remaining year profitable. Positive sixty-session trend was not a refuge either: its mean was worse than that of the nonpositive-trend group. These are subgroup descriptions, not established causal explanations.
In 2023, the adaptive Q75 threshold retained the influence of 2022's high ranges: all executed nights with valid inputs fell in its lower-volatility group. The filter did not exclude those losses.
The bridge from percentage returns to actual execution also matters. In 2023, valid NQ overnight point changes, valued at USD 2 per point, summed to approximately USD 1,386 gross. Restricting them to executable dates left USD 884. Actual MNQ without delayed endpoints produced USD 898 on those dates. Delaying the endpoints under stress reduced gross profit to USD 468; USD 1,600 of friction then left −USD 1,132 before fixed expenses. Instrument, sample dates and execution assumptions all affect that comparison.
Drawdown after accumulated profits
The no-Friday rule, with one micro and stress costs, reached a marked profit peak of USD 4,261 on 2 February 2022. Its worst historical decline ended on 19 November 2025, a drawdown of USD 8,081. About USD 3,730 had already been realized at the peak.
The loss was not confined to starting with little accumulated profit. The strategy gave back gains and finished below its starting balance. Allowing those gains to authorize larger positions can increase losses during the reversal.
In 2026, marked profit peaked at USD 3,485 on 8 May, followed by a USD 4,731 drawdown through 29 July. Approximately USD 2,905 was realized at the peak. These dates come from one-minute observations; peaks use completed closes and troughs use subsequent bar lows, without assuming the order of a bar's high and low.
The frozen rules in partial 2026
The data ends on 9 October 2026 at 21:00 UTC, covering 194 cash-session calendar dates from 2 January. The year is incomplete. Each rule starts flat; no December position is carried into January.
All results in the following table use stress execution costs and fixed expenses through the cutoff:
| Rule | Position size | Closed trades | Closed net profit less all fixed expenses | Marked drawdown |
|---|---|---|---|---|
| Twenty-session trend + Q75 | One fixed micro | 74 | −USD 254 | USD 3,813 |
| Twenty-session trend + Q75 | Starts with one and scales | 74 | −USD 254 | USD 3,813 |
| No Friday entries | One fixed micro | 127 | USD 1,895 | USD 4,731 |
| No Friday entries | Starts with one and scales | 127 | USD 459 | USD 6,086 |
The scaling variant starts with one micro. Its entry limit rises by one contract for each USD 2,000 of current positive realized profit after costs, up to five, and falls again when those profits decline. A changed limit applies only to new entries, not a position already open.
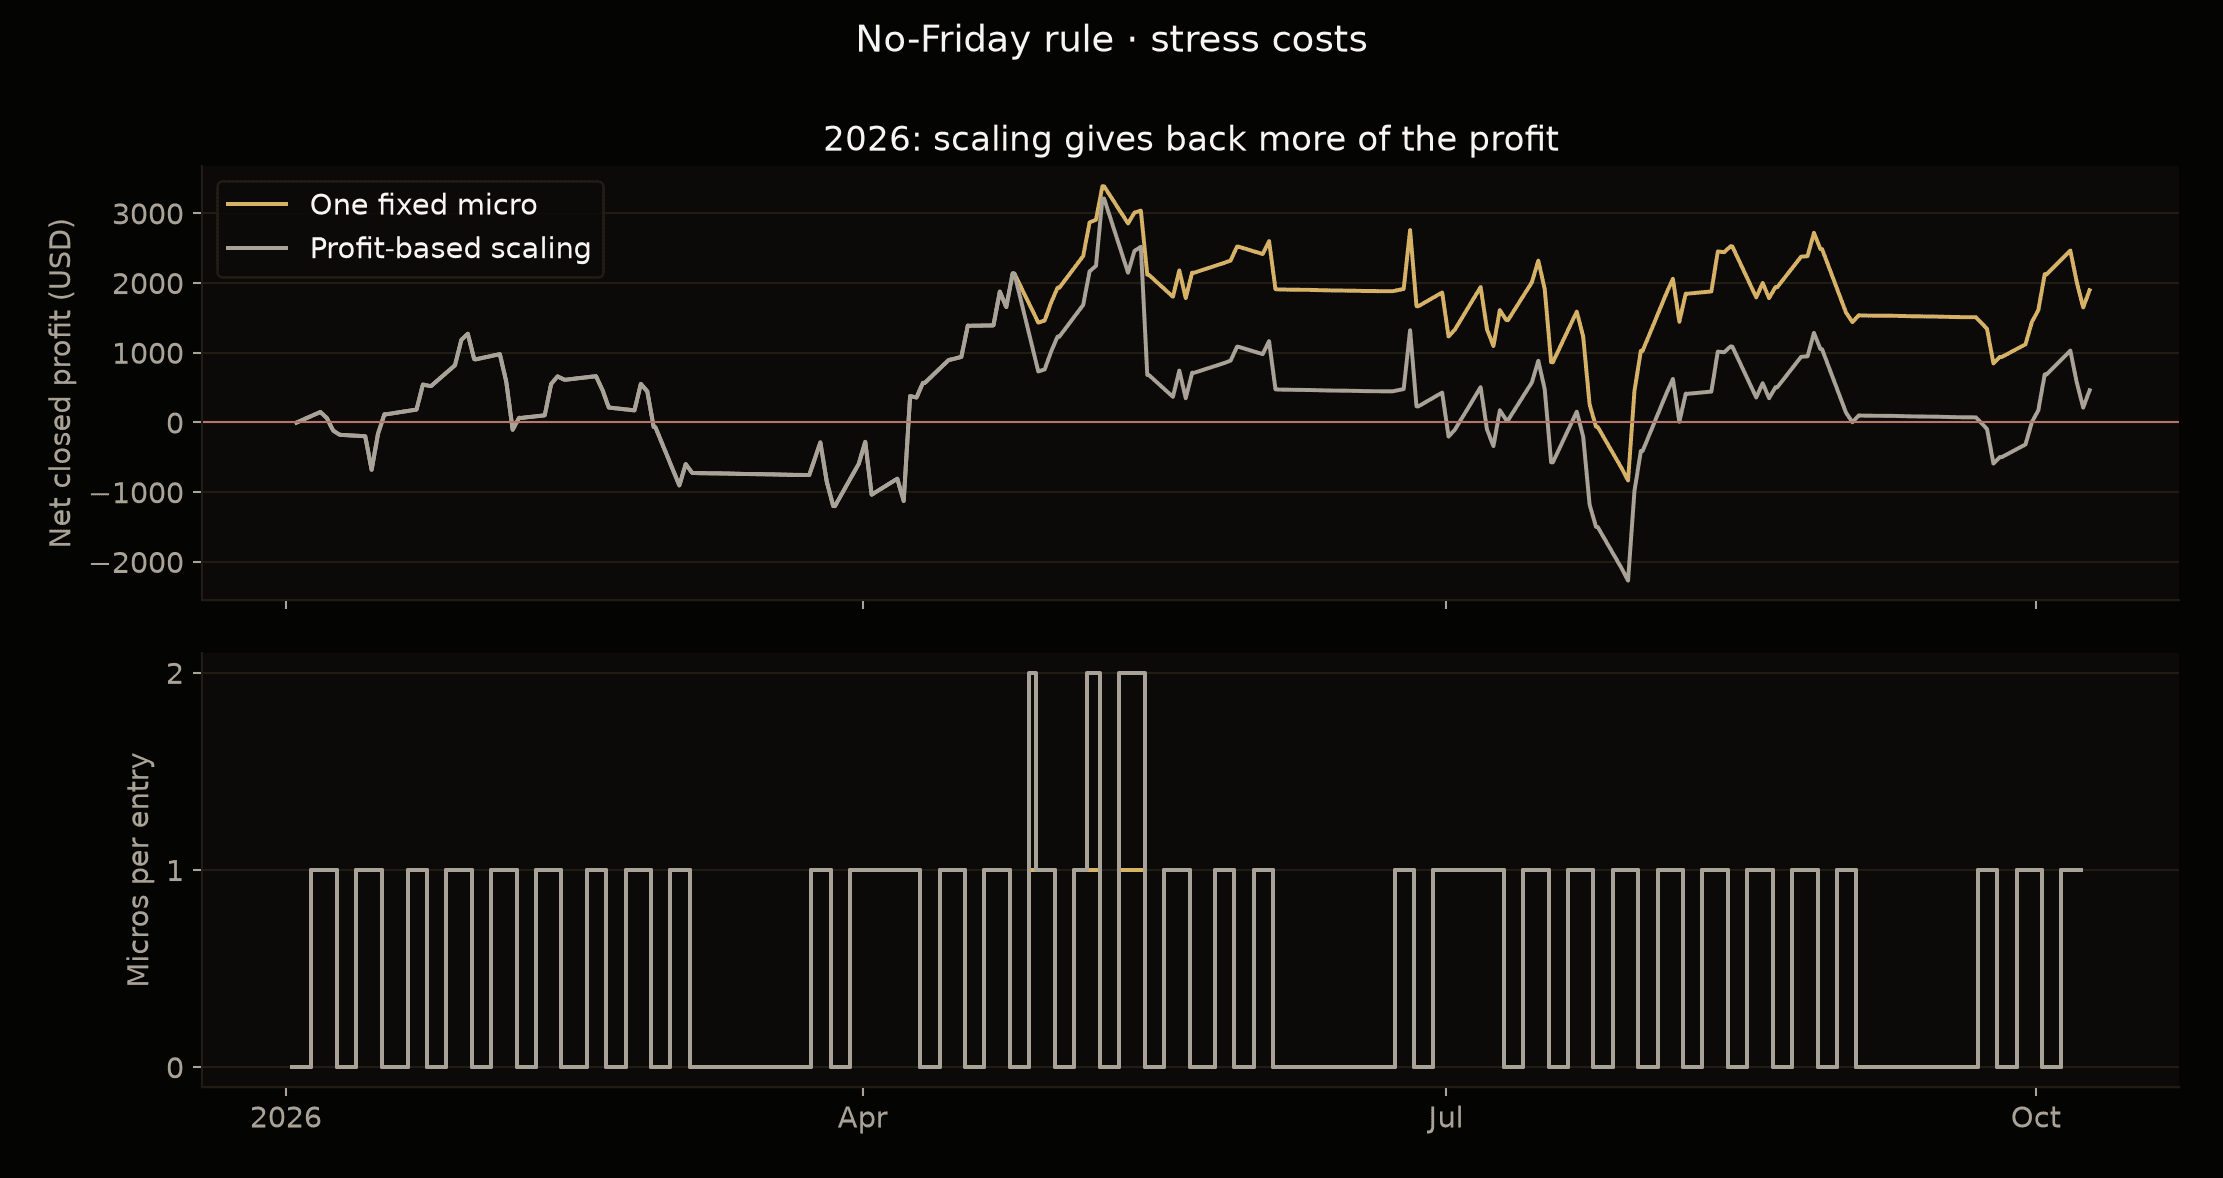
One fixed micro earned approximately USD 1,895 under stress; scaling left USD 459 and increased drawdown from USD 4,731 to USD 6,086. Increasing size after profits did not supply a signal about whether the next period would be favorable.
Twenty-session trend + Q75 still had an open position entered on Friday 9 October. Its closed net result, after all fixed expenses, was −USD 254. Including the open position and its entry commission, marked equity was USD 231 below initial capital. The exit price was not yet known, so that position is not scored as a completed trade.
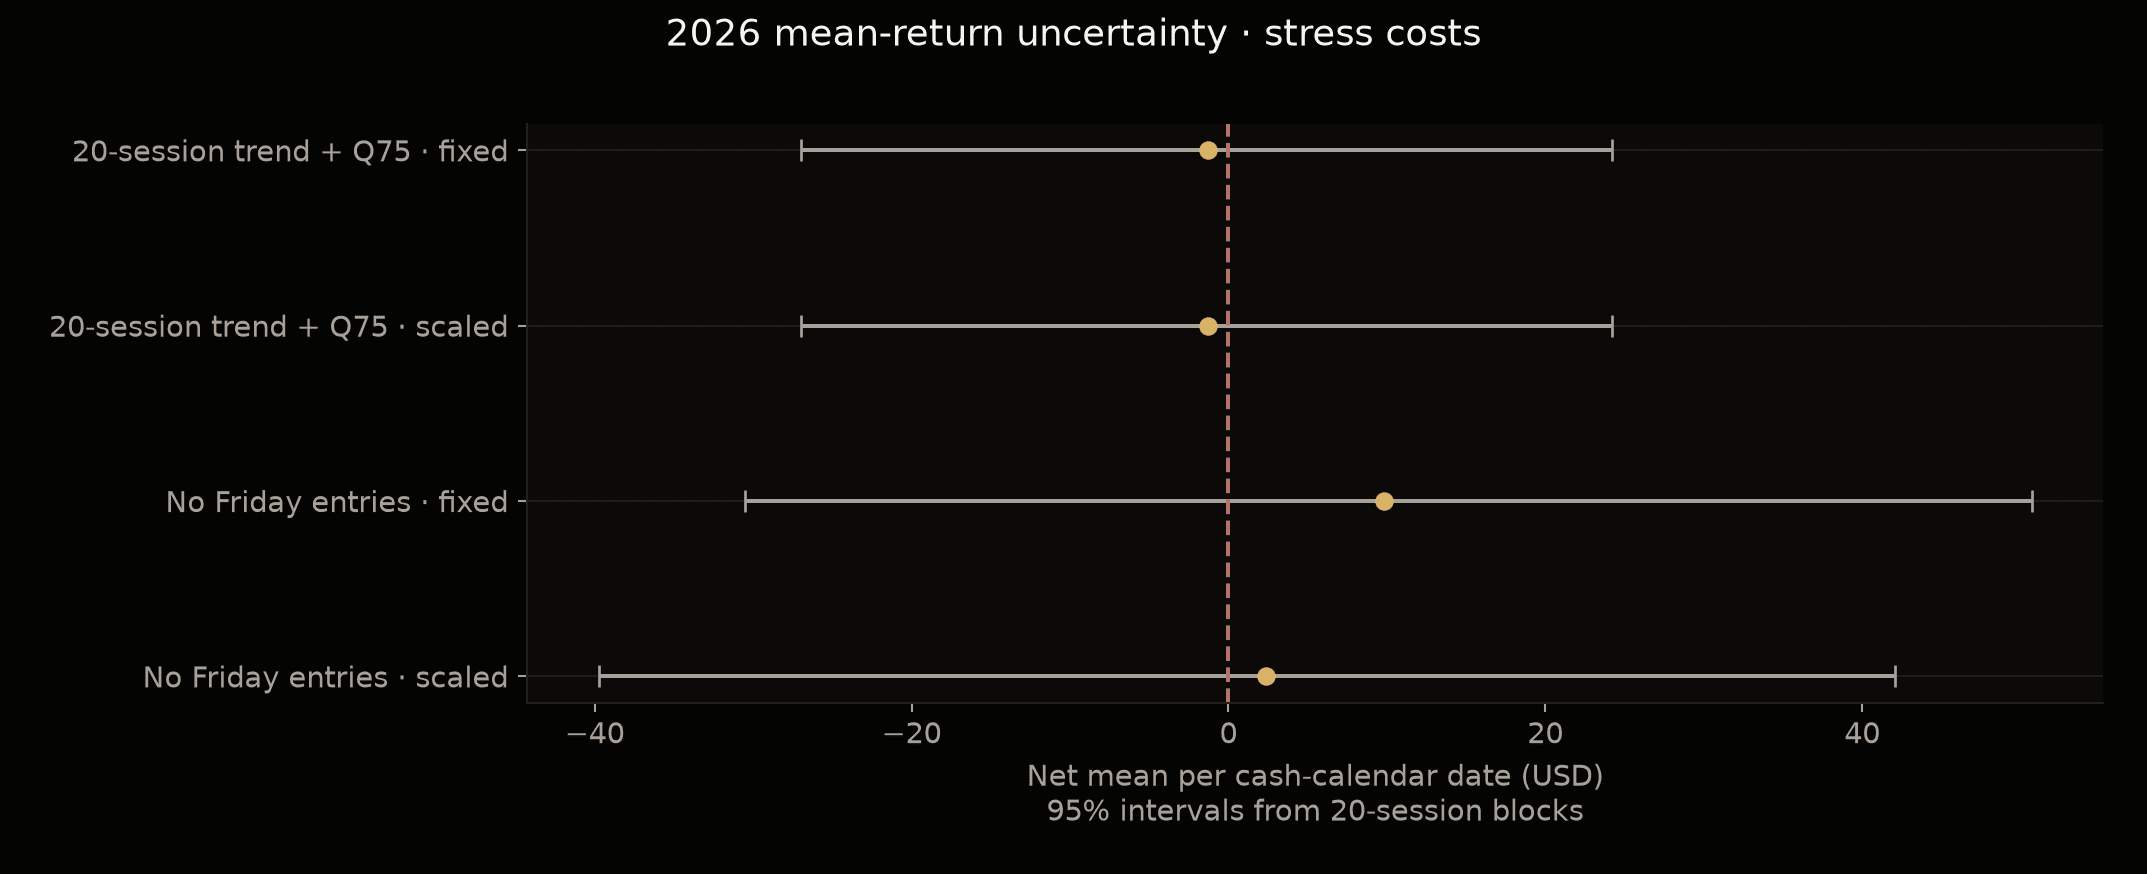
For the fixed-micro no-Friday rule, the stress-cost mean interval is approximately −USD 30.5 to +USD 50.7 per cash-session calendar date. The one-sided p-value, corrected for the two main rules, is approximately 0.626. The observed gain does not distinguish a positive expectation from a favorable run with sufficient precision. A nonsignificant result does not prove the edge is exactly zero.
Funding and capital for a 20% drawdown limit
We use a publicly available broker margin schedule, checked on 11 October 2026, as a reference: USD 4,762 maintenance margin per MNQ. The position crosses the daily futures close, so reduced intraday margin alone is insufficient. Stress assumes USD 5,952.50 per contract, 25% higher, throughout the position. A +50% margin sensitivity is also calculated.
The broker is cited solely as a source for the margin assumption, not as a recommendation. This article is not sponsored, and we receive no compensation for this reference.
No historical margin series is available here. These are constant-margin scenarios using a current reference, not exact reconstructions of each broker requirement in 2025 or 2026. Margin affects the funding needed for a position; it does not establish an edge.
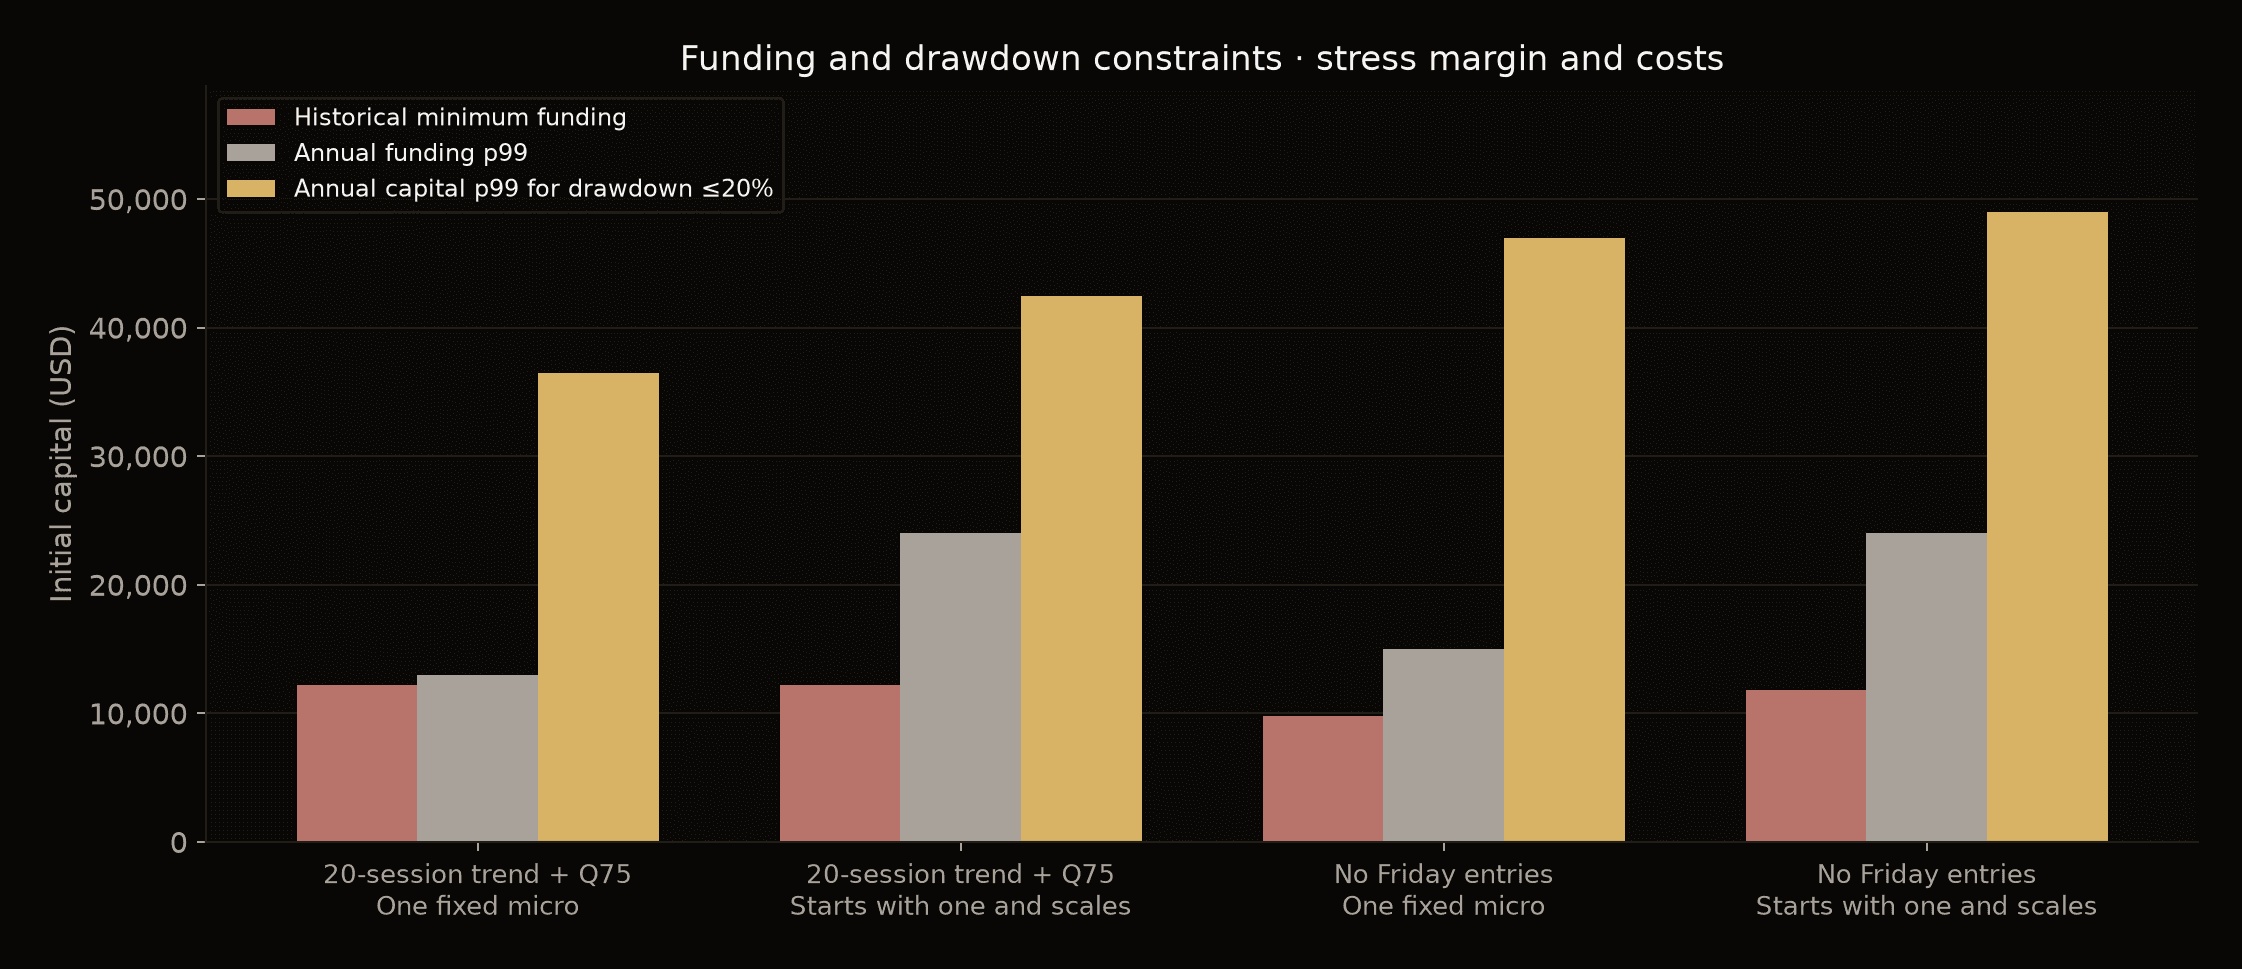
We separate the minimum capital that could have funded the closed historical path from 20,000 simulated one-year paths, each with 252 cash-session calendar dates, for each block length of 10, 20 and 60. Each path resamples historical blocks. Position quantities are determined before each entry; scaling starts with zero realized profit and evolves from that path's own outcomes.
Here, p99 is the 99th percentile of required initial capital in those simulations. We retain the largest p99 across the three block lengths and round upward to USD 500. It is a model-based estimate from resampled history, not a 99% guarantee about future markets.
The table uses stress costs and the stressed margin assumption:
| Rule | Position size | Historical minimum funding | Annual funding p99 | Annual capital p99 for drawdown ≤20% |
|---|---|---|---|---|
| Twenty-session trend + Q75 | One fixed micro | USD 12,187 | USD 13,000 | USD 36,500 |
| Twenty-session trend + Q75 | Starts with one and scales | USD 12,187 | USD 24,000 | USD 42,500 |
| No Friday entries | One fixed micro | USD 9,772 | USD 15,000 | USD 47,000 |
| No Friday entries | Starts with one and scales | USD 11,837 | USD 24,000 | USD 49,000 |
Percentage drawdown is measured against the account's previous marked-equity peak, not its initial deposit. For example, USD 47,000 starting capital plus USD 3,485 of peak marked profit gives peak equity of approximately USD 50,485. A USD 4,731 fall from that peak is about 9.37%.
With one fixed micro, initial capital needed to keep the entire closed historical path within a 20% drawdown was approximately USD 39,134 for twenty-session trend + Q75 and USD 36,142 for no Friday entries. These need not equal a one-year p99: an adverse sequence can last several years. An annual estimate does not promise the same constraint over an indefinite strategy lifetime.
With twenty-session blocks and stress costs, approximately 58.1% and 52.2% of the respective simulated annual paths finished at a loss. More capital reduces those losses as a percentage of the account; it does not change their sign.
The 2026 account simulations used the capital amounts fixed before the new calculation read that year's prices: USD 36,500 and USD 47,000 for the fixed-micro stress variants. Both funded the closed trades and neither triggered the suspension of new entries at 20% drawdown. Maximum drawdown was approximately 9.86% and 9.37%, respectively. The no-Friday rule returned about 4.03% on USD 47,000 over the observed period, after the stated costs and before taxes, with no interest credited to cash. Capital was not reselected after seeing 2026 to improve that percentage.
What the evidence supports
The sample supports positive gross overnight drift in NQ. Volatility-based sizing also reduced historical drawdown against controls with matched average exposure. Neither observation overrides the failed economic validation of the selected rules.
Both final rules failed 2023–2025 validation. The volatility budget with the highest full-sample profit did not preserve that profit in validation. The profitable partial 2026 result has a wide interval, and profit-based scaling worsened the subsequent giveback.
Multiple-comparison adjustments cover the registered families and the two final rules. Mean tests use heteroskedasticity- and autocorrelation-consistent (HAC) errors, alongside temporal block-bootstrap intervals. These adjustments do not retrospectively account for every earlier research decision, other projects' tests or prior familiarity with 2026. The year, trend and volatility subgroups are descriptive analyses, not new rules selected after the test.
The rules use information available before entry. That establishes the timing of the calculation, not stable profitability. No strategy qualified for live trading under this study's registered criteria. The capital estimates describe how to fund the hypotheses and constrain their modeled risk; no capital amount can guarantee that an unproven expectation will become profitable.
Limitations
The simulations use one-minute OHLC bars, not bid/ask quotes or actual orders. Gaps, news and market limits can produce worse stop fills than this resolution reveals. Historical blocks preserve observed sequences but cannot create crises absent from the sample or establish that future regimes will follow the same distribution. The 2026 evaluation covers only part of the year.
The 2026 uncertainty calculation uses the common 193-date interval with resolved outcomes, without resampling an unknown exit. Financial tables allocate fixed expenses across all 194 known calendar dates through the cutoff and report the pending position separately. Profit curves cover the resolved interval; the additional date's expense is included in the financial table and final marked equity.
Sources and further reading
- Bruce Knuteson, Strikingly Suspicious Overnight and Intraday Returns (2020). The study transfers the return decomposition to Nasdaq-100 futures; it is not an exact replication of the Nasdaq Composite or a test of the author's causal explanation.
- Databento, continuous-contract prices and symbology.
- CME Group, MNQ contract specifications and the 6 May 2019 launch announcement.
- AMP Futures, margin requirements, checked on 11 October 2026. The quoted maintenance amount is a current reference, not a historical series.
- Statsmodels, HAC covariance estimation.
For questions, feedback, or further information about these studies, contact research@thehermestrader.com.
Related articles
ICT Macros in NQ: When Hourly Moves Begin
An empirical study of NQ hourly origins, timing boundaries, session context and closing windows, separating recurring price structure from predictive value.
NQ Weekly Profile Research: What 16 Years of Data Reveals
An empirical study of 769 non-roll NQ weeks maps when weekly extremes form, which price paths recur, and what Friday's close suggests about the following week.
Can We Forecast the Next NQ Liquidity Target?
A three-window study of the first NQ liquidity pool reached in New York trading. A frozen directional model was accurate on selected forecasts, but did not outperform the nearest active pool on the same events.