ICT Macros in NQ: When Hourly Moves Begin
An empirical study of NQ hourly origins, timing boundaries, session context and closing windows, separating recurring price structure from predictive value.
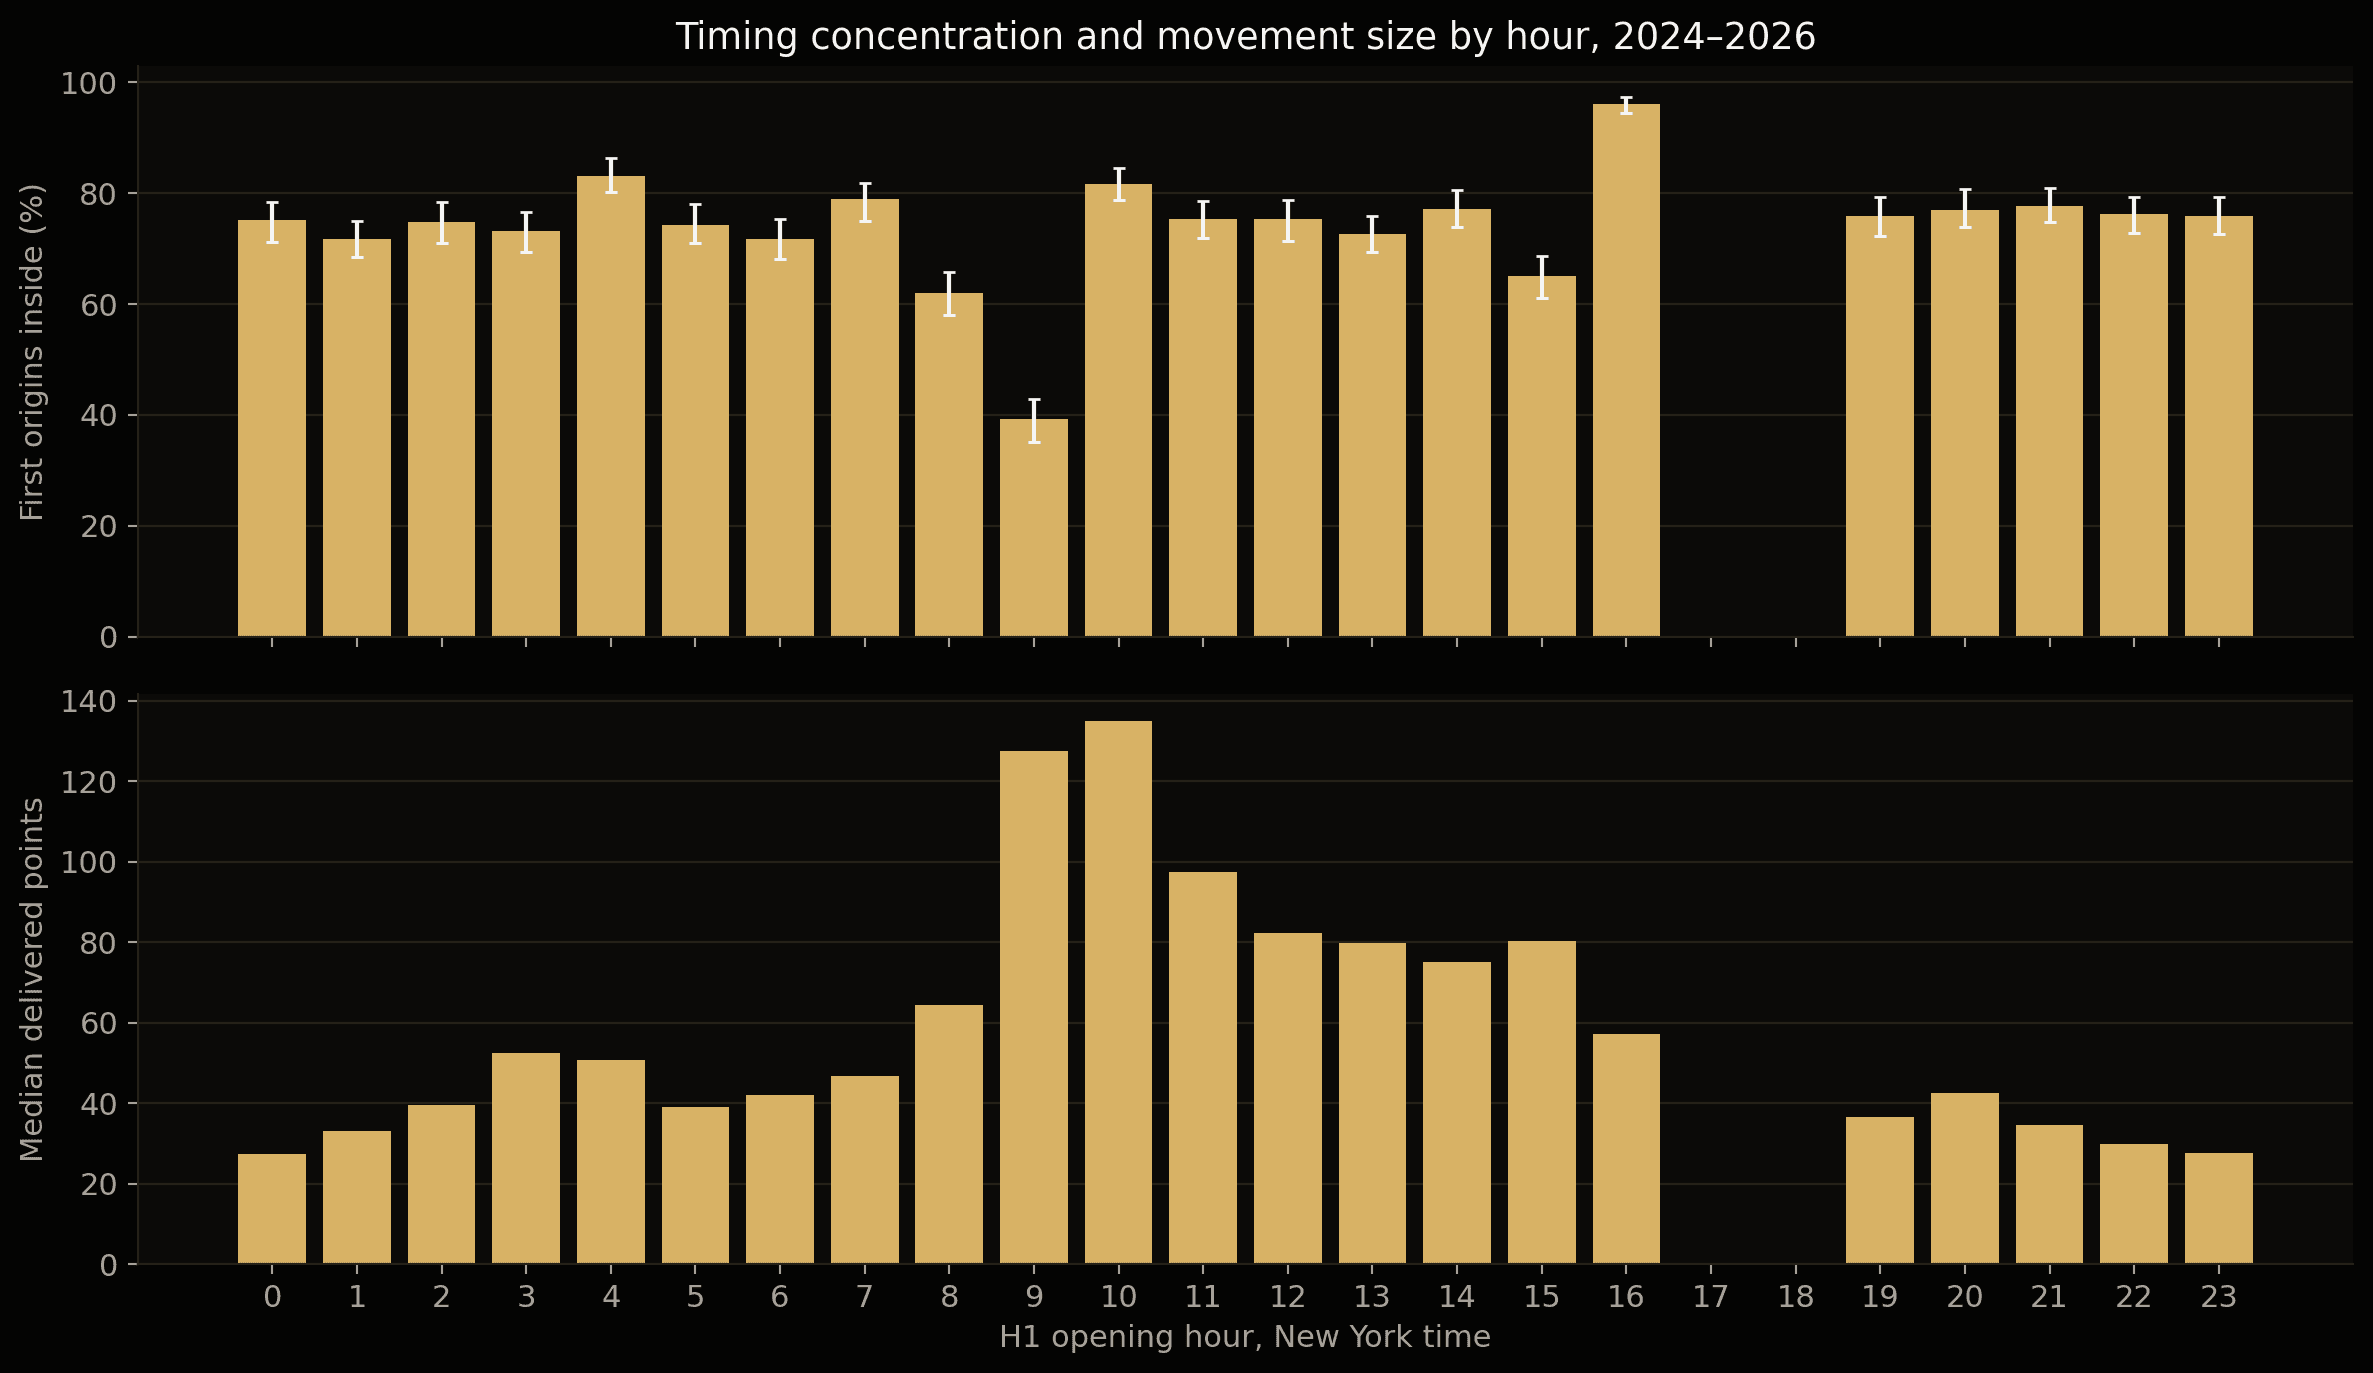
Table of contents
- Research scope
- Data and methodology
- The sample
- Defining the origin of an hourly move
- Measuring context and subsequent behavior
- The main result: approximately three quarters of first origins fall inside the macro
- The first origin and the last continuation swing are different observations
- Does the concentration persist across years?
- Which hours have the strongest combination of timing and delivery?
- What happens five minutes before and after the macro?
- Why the search boundary changes the first-origin percentage
- Do the standard macro times contain more origins than alternative windows?
- Does session context change macro behavior?
- Does consolidation lead to a directional next session?
- Does a macro without a breakout make the next one more likely to break out?
- What happens during the closing windows?
- Does the sequence matter?
- What the results imply for using macros
- Limitations
- Conclusion
- Sources
The first qualifying origin of an hourly NQ move formed inside the hourly macro in 73.27% of eligible observations.
This is a retrospective market-structure statistic, not a signal known before the hour begins and not a trade win rate.
That is 28,481 of 38,873 hours in the comparison sample, from January 2016 to March 2026. The corresponding figures were 73.43% over the most recent five years and 72.87% over the most recent three years.
The concentration is persistent, but it is not uniform across the trading day. In 2024–2026, the origin of the 10:00–11:00 candle formed inside 09:50–10:10 in 81.67% of eligible hours. For the 09:00–10:00 candle and its 08:50–09:10 macro, the figure was 39.20%.
Those differences matter. A window that frequently contains the origin of a move is not necessarily attached to the hour with the largest movement. Nor does every valid origin occur inside the conventional boundary.
This study measures those distinctions: where hourly moves begin, how their timing changes across hours and years, what happens immediately outside the macro, and whether previous sessions or earlier closing windows help explain what follows.
Research scope
An ordinary ICT hourly macro covers the last ten minutes before an hour and the first ten minutes after it. For the H1 candle opening at 10:00, the associated macro is 09:50–10:10. A qualifying origin can form anywhere within that window; it need not form at 09:50.
The starting point was Petar’s study of NQ hourly macros, which reported that 72.0% of first qualifying delivery swings appeared inside the macro. We replicate its central question with a separate NQ dataset, then extend the analysis beyond the aggregate percentage.
The research questions are:
- How often does the first qualifying origin form inside the hourly macro?
- How does its timing differ from the last qualifying continuation swing?
- Which hours combine frequent in-window origins with larger delivered moves?
- Does the timing pattern persist across years?
- Do qualifying origins also form in the five minutes immediately before and after the macro?
- Does the preceding session, or the outcome of the preceding macro, help explain the next window?
- How do the four closing windows behave, individually and in sequence?
Data and methodology
The sample
The historical market data used in this study was obtained from Databento.
The dataset contains 5,421,945 one-minute NQ continuous-futures observations, spanning June 2010 through June 12, 2026. All clock times use New York local time, including daylight-saving changes.
We exclude 64 trading dates containing contract rolls, windows mixing contracts, and observations with missing required minutes. Missing bars are not filled. A trading date begins at 18:00 New York time.
The replication uses January 4, 2016–March 25, 2026, with H1 openings from 00:00 through 16:00, matching the source article’s stated dates and hours. The extensions use the available history through June 2026 and examine every supported hourly slot.
Coverage is less complete overnight in the early years. The 16:00–17:00 candle becomes available in 2021. The 17:00 maintenance interval and missing pre-open context prevent valid ordinary-macro observations at 17:00 and 18:00. Consequently, a sixteen-year history does not provide sixteen complete years for every hour.
Defining the origin of an hourly move
For each completed H1 candle:
- If the candle closes bullish, identify confirmed one-minute swing lows preceding its hourly high. For a bearish candle, identify swing highs preceding its hourly low.
- Require a strict three-bar swing: the middle low must be below both neighboring lows, or the middle high above both neighboring highs.
- Require the swing to remain held until the terminal extreme, allowing no more than 0.25 points of violation.
- Require the distance from the swing to the terminal extreme to cover at least 60% of the hourly high–low range.
- Record both the first and the last qualifying swing.
The terminal extreme is the first occurrence of the H1 high in a bullish candle, or the H1 low in a bearish candle. A swing must be confirmed before that terminal bar. Dojis and hours without a qualifying swing remain separate from eligible observations.
For the replication, the candidate search begins ten minutes before the H1 opening time. The source-compatible macro counts minute-bar starts from h−10 through h+10, inclusive: 21 bar starts. The five-minute extension and the separate breakout tests use explicitly defined, non-overlapping minute bins.
The origin statistic describes the anatomy of a completed hourly move. Final direction and the terminal extreme determine which swings qualify; it is not a probability available before the hour unfolds.
Measuring context and subsequent behavior
To examine previous-session information without using the following hour’s final direction, we use a separate outcome: whether the last close of an exact twenty-minute macro finishes more than one tick beyond the preceding thirty-minute high or low.
All explanatory information is available before the window starts. Models are trained on 2010–2019 and evaluated in 2020–2023 and 2024–2026. A separate 2021–2023 training sample supports later overnight coverage. Comparisons use the same observations within each experiment.
Uncertainty is estimated by resampling trading dates, including twenty-day blocks for annual and predictive checks. Multiple-comparison corrections are applied within the relevant transition and session families. The definitions and sample sizes below distinguish the different observation units.
The main result: approximately three quarters of first origins fall inside the macro
The replication contains 40,048 directional hours with usable data. Of these, 38,873 have at least one qualifying swing. In 28,481 of those eligible hours, the first qualifying origin lies inside the macro.
That produces the 73.27% headline rate, with a 95% day-bootstrap interval of 72.81%–73.69%. If hours without a qualifying swing are also included in the directional-hour denominator, the rate is 71.12%.
The distinction makes the result precise: roughly three quarters of the hours meeting the delivery-swing definition have their first selected origin within the macro. The result does not mean that three quarters of all scheduled hours produce the same price pattern.
| Comparison period | Eligible hours | First origin inside macro | Last qualifying swing inside macro | Median first-origin delivery |
|---|---|---|---|---|
| Jan 2016–Mar 2026 | 38,873 | 73.27% | 21.23% | 35.50 points |
| Mar 2021–Mar 2026 | 20,619 | 73.43% | 21.53% | 52.50 points |
| Mar 2023–Mar 2026 | 12,368 | 72.87% | 21.20% | 52.75 points |
These periods end on March 25, 2026; the five- and three-year samples begin on March 26 of their respective starting years. They overlap and should not be treated as independent replications.
Our 73.27% is close to the source article’s 72.0%. Other measurements differ: its reported last-swing concentration was 24.9% and its median delivered distance was 49.5 points, compared with 21.23% and 35.5 points here. This is a conceptual replication, not an exact reconstruction of unpublished code. Data coverage and choices about swing identification, search boundaries and eligibility can affect the result.
The first origin and the last continuation swing are different observations
The first qualifying swing identifies an early origin capable of delivering a substantial fraction of the hour’s range. The last qualifying swing identifies a later held swing that still meets the same delivery requirement. Both can belong to the same hourly move.
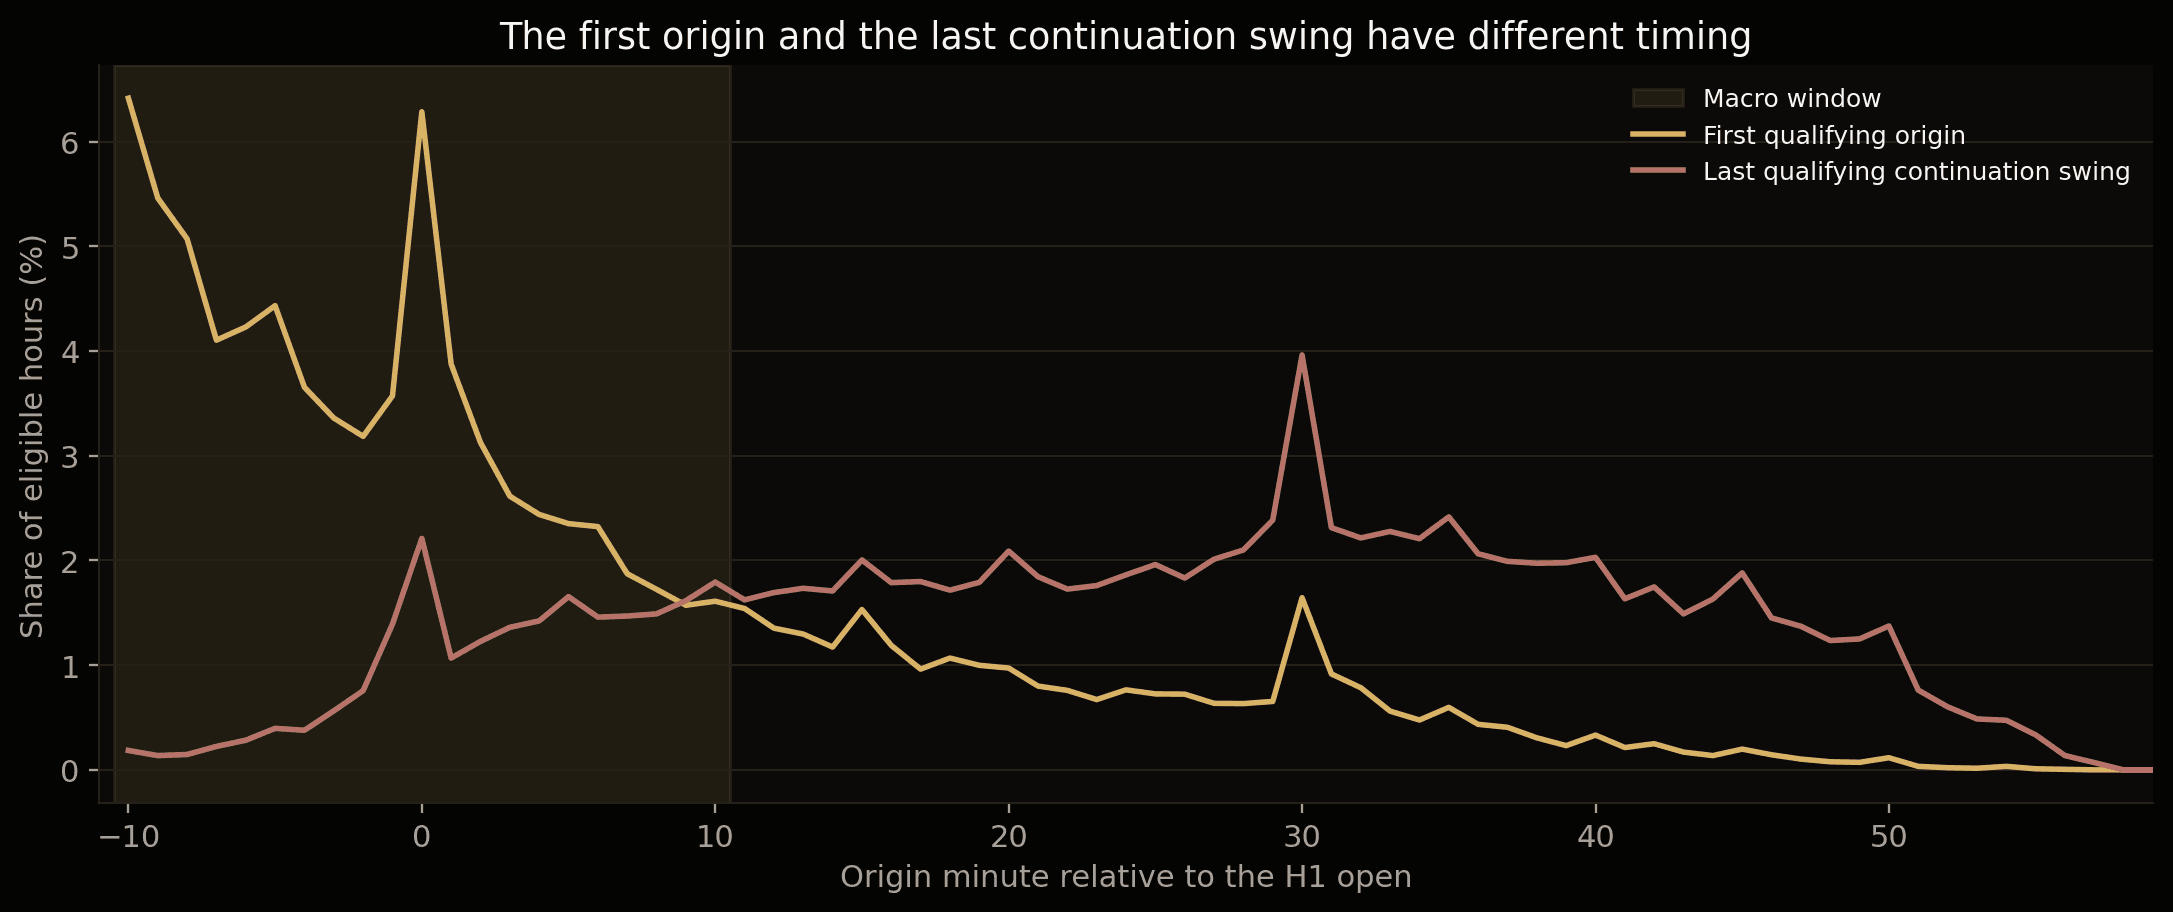
The difference between 73.27% and 21.23% shows why “the origin forms in the macro” and “a later continuation swing forms in the macro” cannot be used interchangeably. Much of the later qualifying structure develops after the window ends.
Does the concentration persist across years?
Yes, in the descriptive sense that high in-window concentration recurs throughout the sample. The three comparison periods remain close to 73%, while median delivered distance rises from 35.5 points in the full comparison sample to 52.75 points in the latest three-year sample.
The calendar-year extension gives a more detailed view. Across hourly centers 00:00–16:00, annual first-origin concentration ranges from 69.63% to 74.70% over the observed 2010–2026 years. Both 2010 and 2026 are partial years.
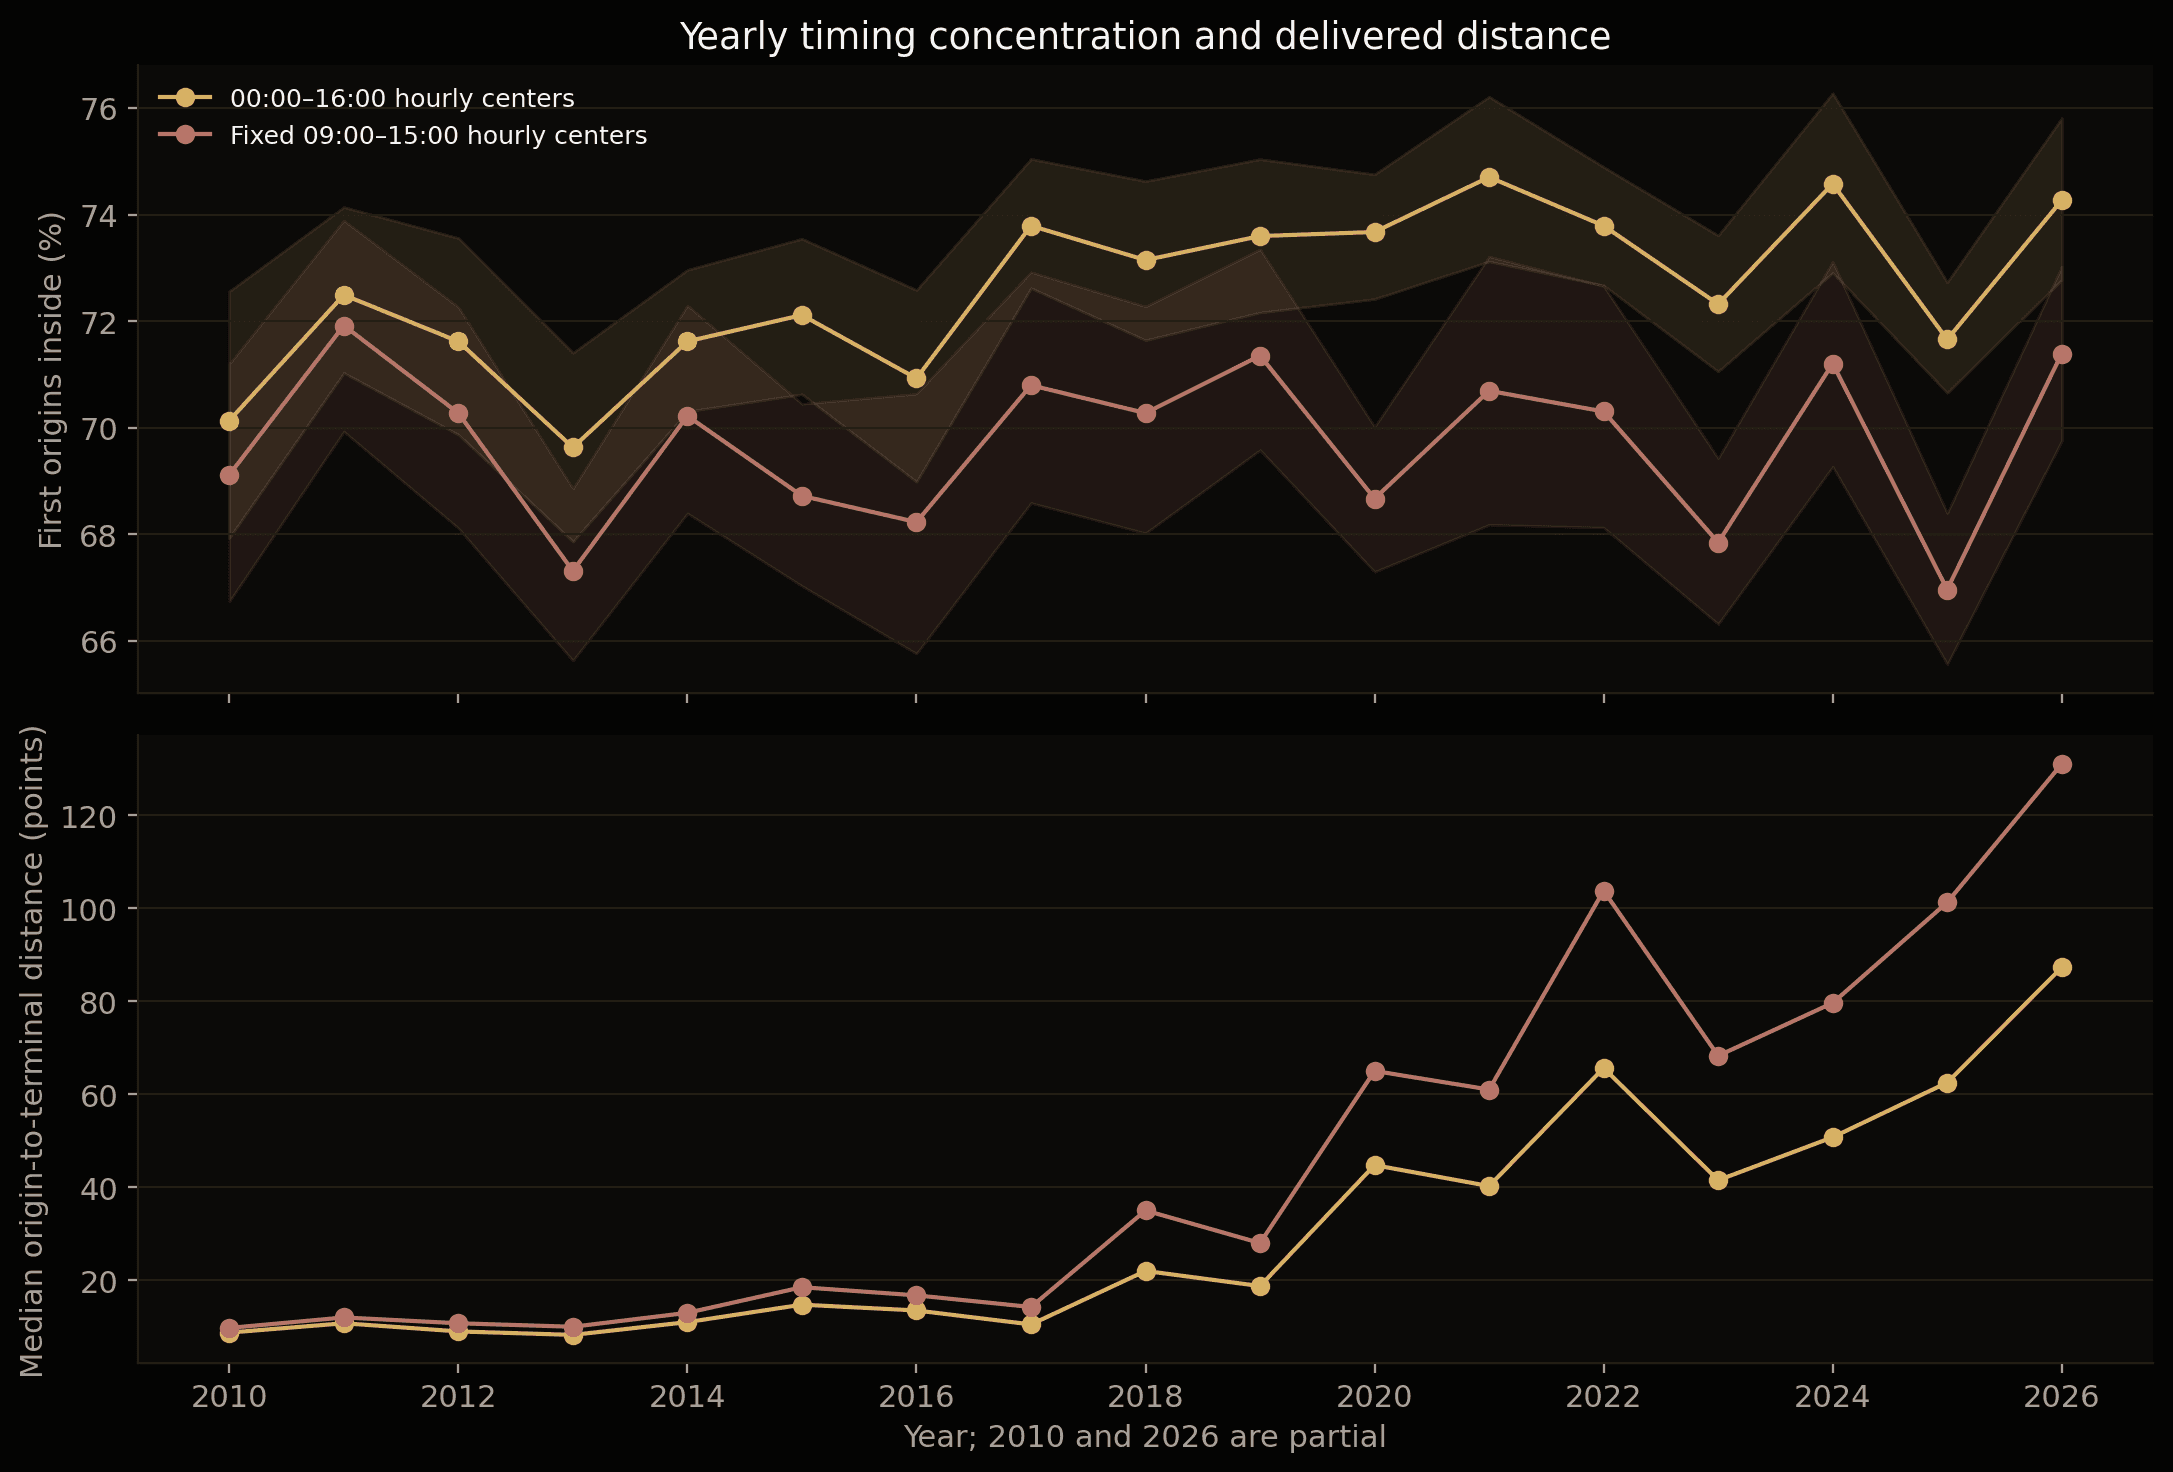
The recurring concentration survives substantial changes in the size of NQ moves. However, recurrence does not imply identical probabilities in every year. Missing historical overnight data and the addition of the 16:00 candle also affect the composition of the broad sample.
Which hours have the strongest combination of timing and delivery?
The aggregate percentage hides large differences across the day. The next comparison uses 2024–2026, through June 12, so that the broader set of hours has recent coverage.
| H1 candle | Associated macro | Origin inside macro | Median delivered distance |
|---|---|---|---|
| 02:00–03:00 | 01:50–02:10 | 74.75% | 39.50 points |
| 04:00–05:00 | 03:50–04:10 | 83.11% | 50.88 points |
| 07:00–08:00 | 06:50–07:10 | 78.86% | 46.75 points |
| 08:00–09:00 | 07:50–08:10 | 61.94% | 64.50 points |
| 09:00–10:00 | 08:50–09:10 | 39.20% | 127.50 points |
| 10:00–11:00 | 09:50–10:10 | 81.67% | 135.00 points |
| 11:00–12:00 | 10:50–11:10 | 75.29% | 97.50 points |
| 15:00–16:00 | 14:50–15:10 | 65.07% | 80.25 points |
| 16:00–17:00 | 15:50–16:10 | 96.03% | 57.25 points |
The 10:00–11:00 candle combines a high in-window origin rate with the largest median delivered distance among the supported hours in this recent sample.
The 09:00–10:00 candle delivers a similarly large distance, but its first selected origin much less often lies inside 08:50–09:10. The 09:30 cash open falls within that H1 candle, after its macro. This is consistent with a different intrahour structure around the opening transition; it does not by itself establish the cause of the difference.
The 16:00 result requires a separate reading. It concerns the 16:00–17:00 candle and a macro extending to 16:10. It is not a measurement of the final ten minutes before the 16:00 regular-session close.
The useful distinction is between when a substantial move originates and how far the hour subsequently travels. Both describe an hour’s behavior, and one cannot substitute for the other.
What happens five minutes before and after the macro?
A macro boundary does not prevent a qualifying swing from forming just outside it. To measure those neighboring minutes, we extend candidate identification before the original search boundary and preserve the same swing, holding and delivery requirements.
For a 10:00 center, the exact-minute bins are:
- Before: bar starts from 09:45 through 09:49.
- Inside: bar starts from 09:50 through 10:09.
- After: bar starts from 10:10 through 10:14.
This twenty-minute interior differs by one bar from the inclusive replication convention.
Across 64,037 hours eligible under the extended h−30 search, at least one qualifying origin appears:
- in the preceding five minutes: 23.26%;
- inside the twenty-minute macro: 70.80%;
- in the following five minutes: 31.03%.
These percentages can overlap. 19.80% of those hours contain qualifying origins both before and inside the macro. A later qualifying swing may be part of the same move, rather than the beginning of a separate move.
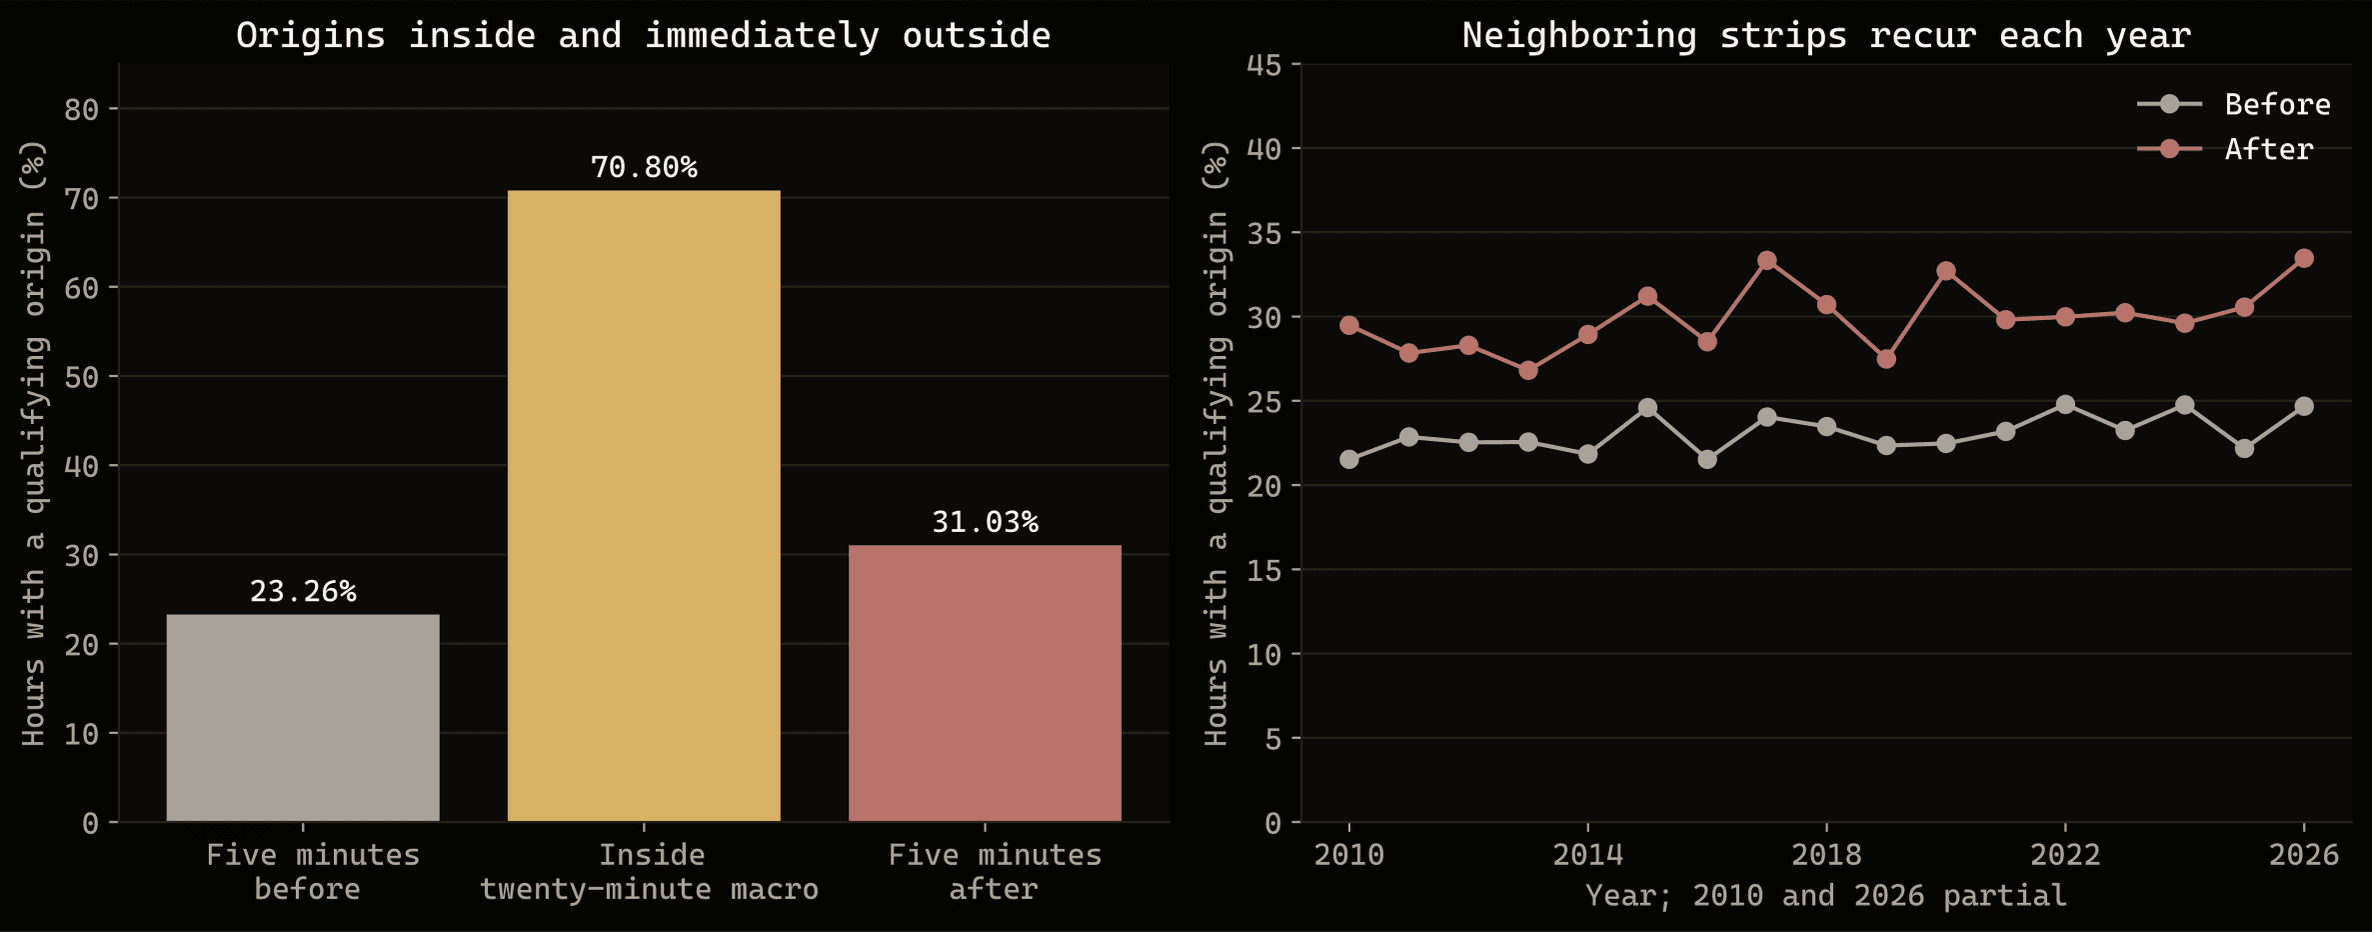
Both neighboring strips contain qualifying origins in every observed year. The phenomenon is not confined to one isolated period. Its frequency varies, and wider windows necessarily capture more candidates; these observations do not establish that widening or shifting the macro improves its usefulness.
Why the search boundary changes the first-origin percentage
“First” must be defined relative to a search interval. Looking farther back can reveal an earlier qualifying swing without removing the valid swings already found inside the macro.
On 63,161 observations eligible under both searches, the inclusive in-window first-origin rate is 73.46% when searching from h−10, but 32.94% when searching from h−30. The headline remains a valid measurement of the stated algorithm, but it is not a search-independent probability for the beginning of every market move.
This explains why the first-origin statistic and the presence-of-any-origin statistic answer different questions. The latter confirms that valid in-window swings remain frequent even when earlier candidates are admitted.
Do the standard macro times contain more origins than alternative windows?
The macro’s share of minute bars is not an adequate chance benchmark. A swing selected because it precedes the final hourly extreme already has a non-uniform timing distribution.
Applying the same first-origin selector to 15,000 simulated random-walk paths yields 66.93% in-window concentration. The simulation is a diagnostic of the selection rule, not a calibrated model of NQ. Its result shows that a high raw concentration can arise partly from how the origin and terminal are defined.
A second comparison retains common day-hour observations and shifts the entire hourly analysis by 15, 30 and 45 minutes. The actual clock-hour concentration exceeds the average shifted concentration by:
| Period | Difference from shifted controls | 95% interval |
|---|---|---|
| 2010–2019 | −0.41 percentage points | −1.05 to +0.25 |
| 2020–2023 | +2.54 percentage points | +1.78 to +3.27 |
| 2024–2026 | +1.52 percentage points | +0.64 to +2.47 |
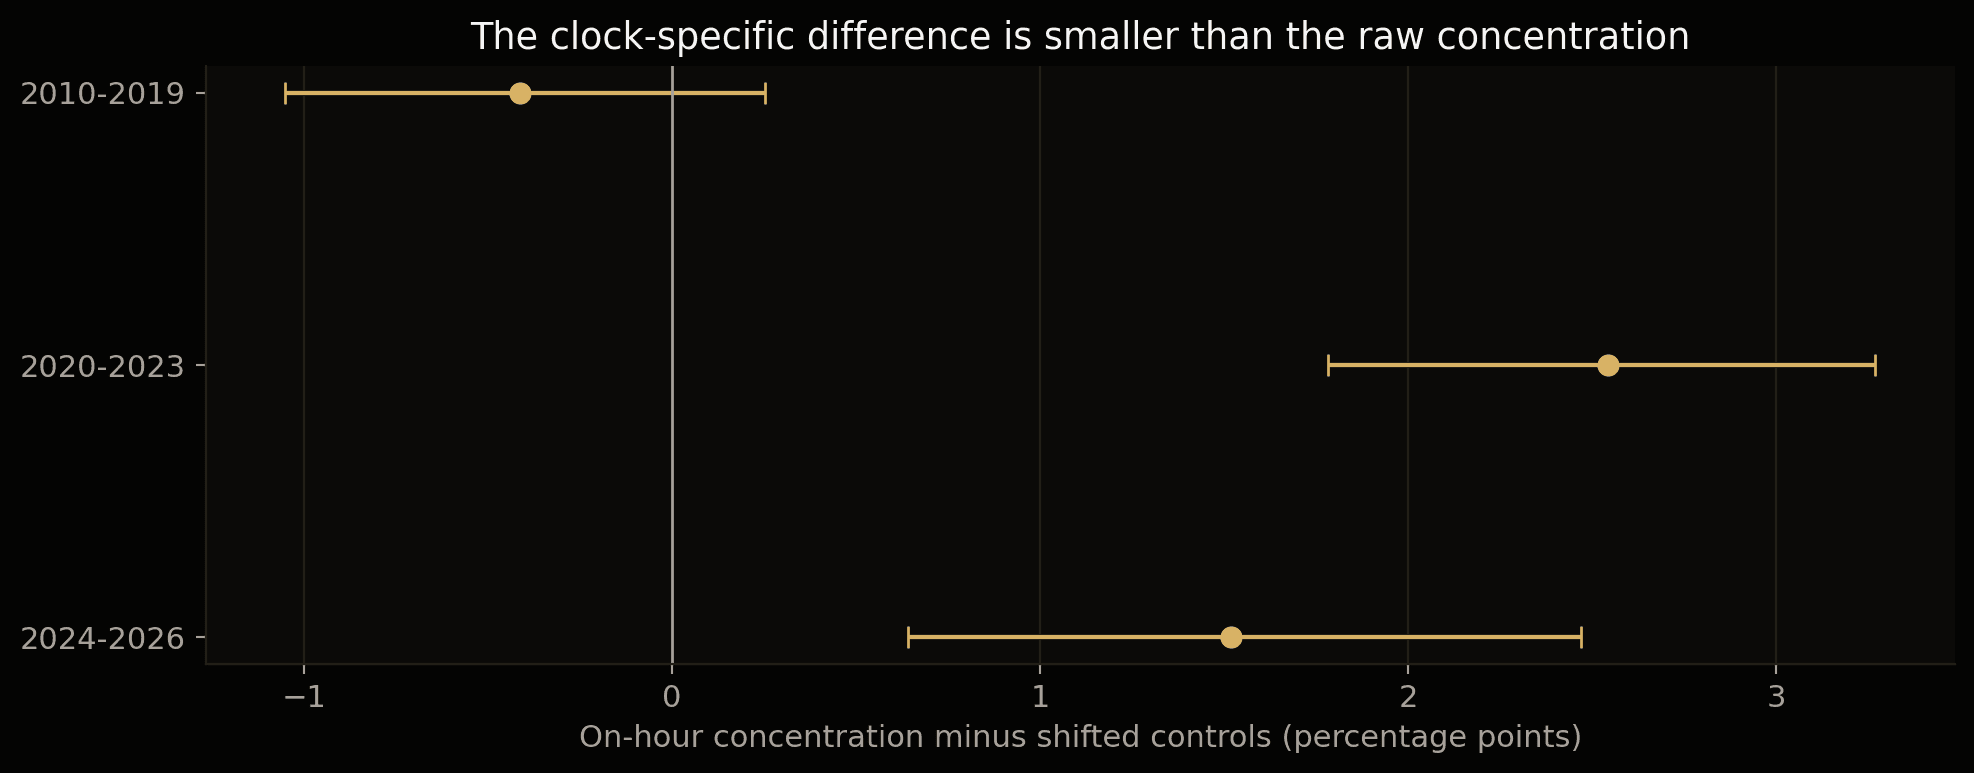
The later periods show a positive clock-aligned difference, but it is much smaller than the raw 73% concentration. The study therefore supports a recurring timing structure while leaving a substantial role for selection geometry and ordinary intrahour price behavior.
Does session context change macro behavior?
We divide the trading day into twelve analytical blocks:
| Block | New York time | Block | New York time |
|---|---|---|---|
| Globex evening | 18:00–00:00 | Opening range | 09:30–10:00 |
| Asia proxy | 00:00–02:00 | Morning | 10:00–12:00 |
| London proxy | 02:00–05:00 | Midday | 12:00–14:00 |
| Transition | 05:00–07:00 | Afternoon | 14:00–15:00 |
| Premarket | 07:00–09:00 | Closing hour | 15:00–16:00 |
| Pre-open | 09:00–09:30 | Post-close | 16:00–17:00 |
These are explicit research boundaries. The Asia and London labels are fixed New York-time proxies, not local exchange calendars. The opening range is examined as context and in session transitions; it contains no ordinary integer-hour macro center.
For the twenty-minute final-close breakout outcome, the baseline model uses the clock hour and the preceding thirty-minute range’s direction and efficiency. Added session information describes the latest completed scheduled block: direction, efficiency, relative range size and the current price’s position within that range.
In 2024–2026, completed-session information reduces Brier probability error from 0.244635 to 0.241918, an improvement of 0.002716 across 9,645 observations. Lower Brier error means better probability forecasts; it is not a percentage-point change in event frequency.
A generic trailing two-hour range provides a stronger comparison. Adding completed-session features to that model improves Brier error by 0.001055 across 9,613 matched observations. Its twenty-day block interval remains positive, 0.000306–0.001775. The gain is small, and its yearly contribution is almost zero in 2024 and larger in 2025 and the partial 2026 sample.
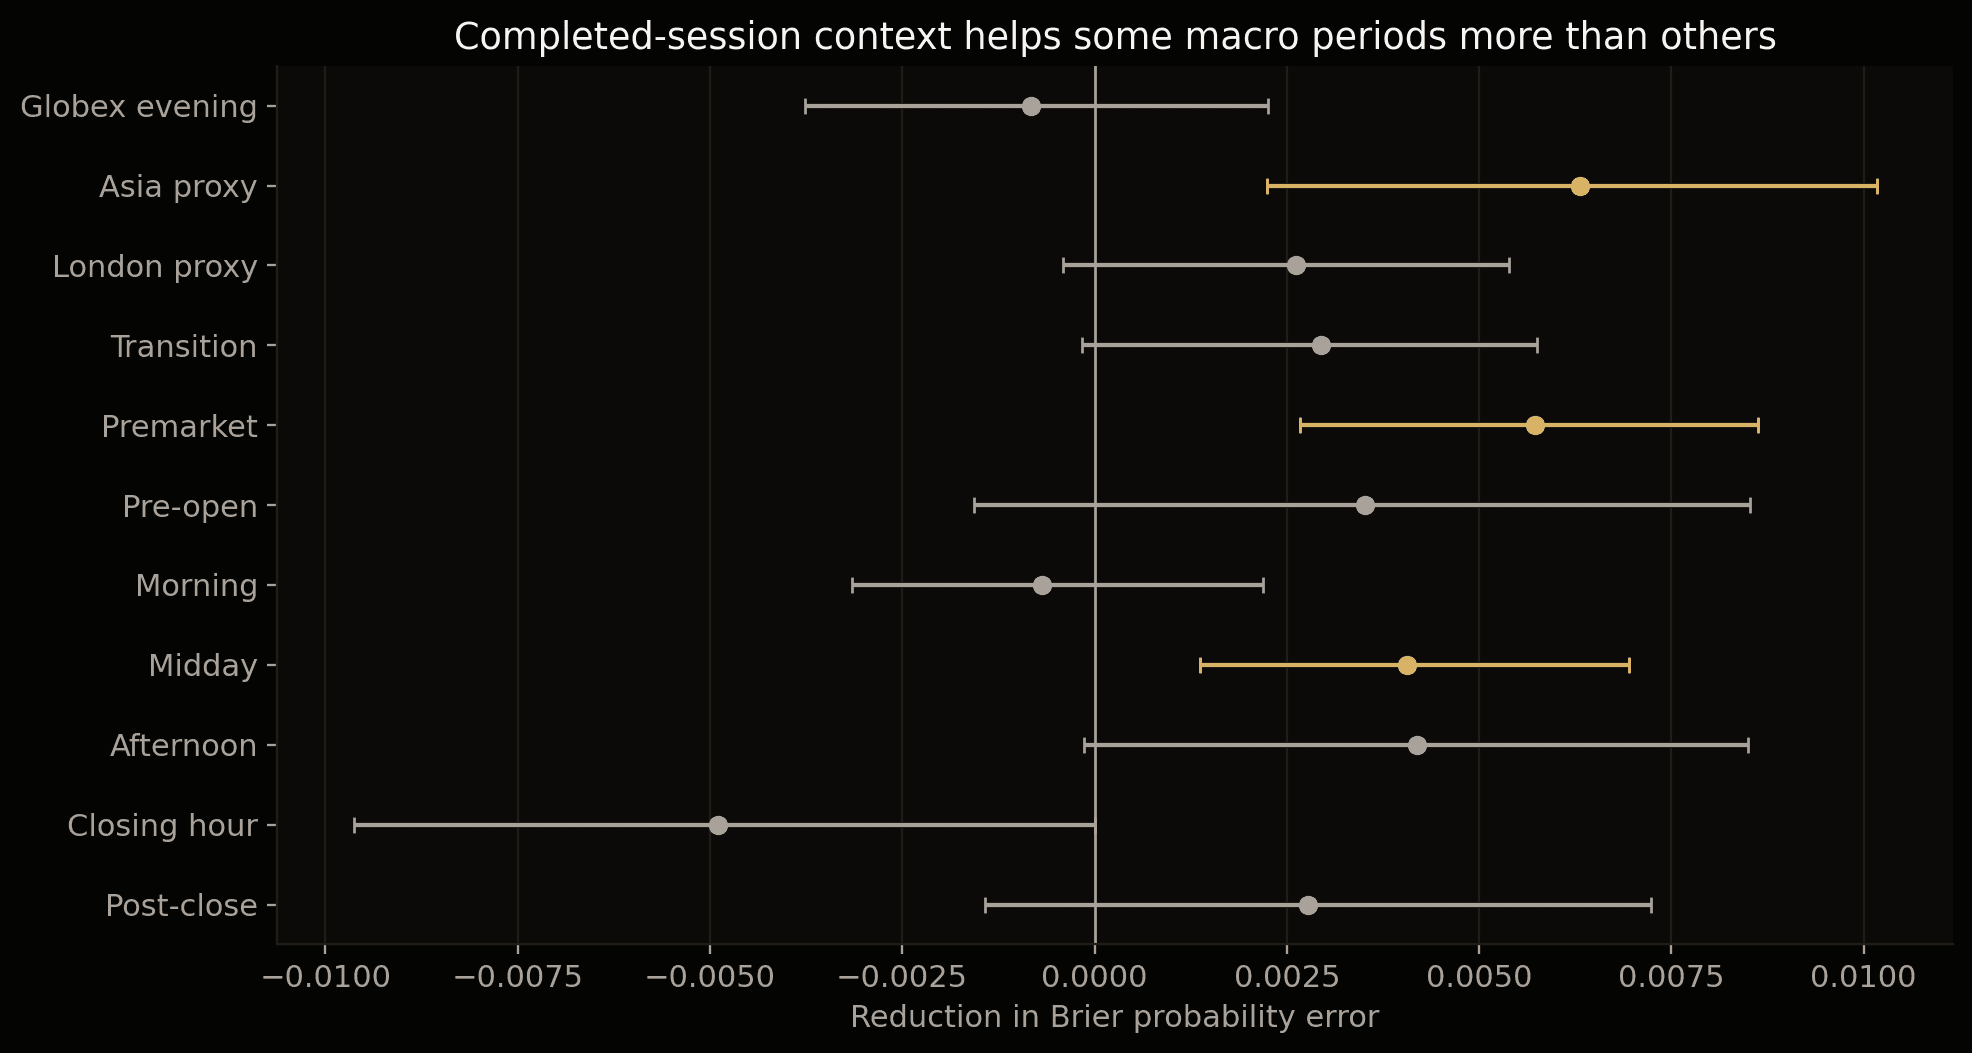
In that later-trained model, the clearest positive session-level gains occur in Asia, premarket and midday. Other blocks are less conclusive; a pooled gain does not imply that the same context rule helps every session.
Does consolidation lead to a directional next session?
We define efficiency as absolute open-to-close displacement divided by the block’s high–low range. Consolidation has efficiency below 0.30; a directional next block has efficiency of at least 0.60.
Across fourteen session transitions, none of the recent directionality differences survives the specified multiple-comparison correction. For example, London consolidation is followed by a directional premarket in 30.69% of cases, compared with 30.53% otherwise. Morning consolidation is followed by a directional midday in 29.88%, versus 34.40% otherwise.
These results do not support a general rule that a quiet session must be followed by a directional one.
Does a macro without a breakout make the next one more likely to break out?
For this question, “no breakout” means that the window’s final close does not finish beyond the reference range. Price may still have moved substantially inside the window.
We pair macros exactly one hour apart, with the first outcome known before the second begins. None of the seventeen supported recent transition groups survives Holm correction. Adding the preceding breakout indicator to a clock-only model does not improve pooled forecasting error in either evaluation period.
A macro’s lack of a final-close breakout is therefore insufficient evidence for a general compensating breakout in the next macro.
What happens during the closing windows?
The closing-hour analysis examines four windows discussed in ICT teaching: 14:50–15:10, 15:15–15:45, 15:40–16:00 and 15:50–16:00. The question is whether substantial directional events occur within them and whether the absence of an earlier event changes the probability of a later one.
Here a qualifying event requires a close more than one tick beyond the preceding thirty-minute range, together with displacement of at least half that range from its last close. This observable event differs from the retrospective H1-origin definition, so its frequencies should not be compared directly with the 73% result.
The sample contains 3,923 complete non-roll days, including 600 in 2024–2026.
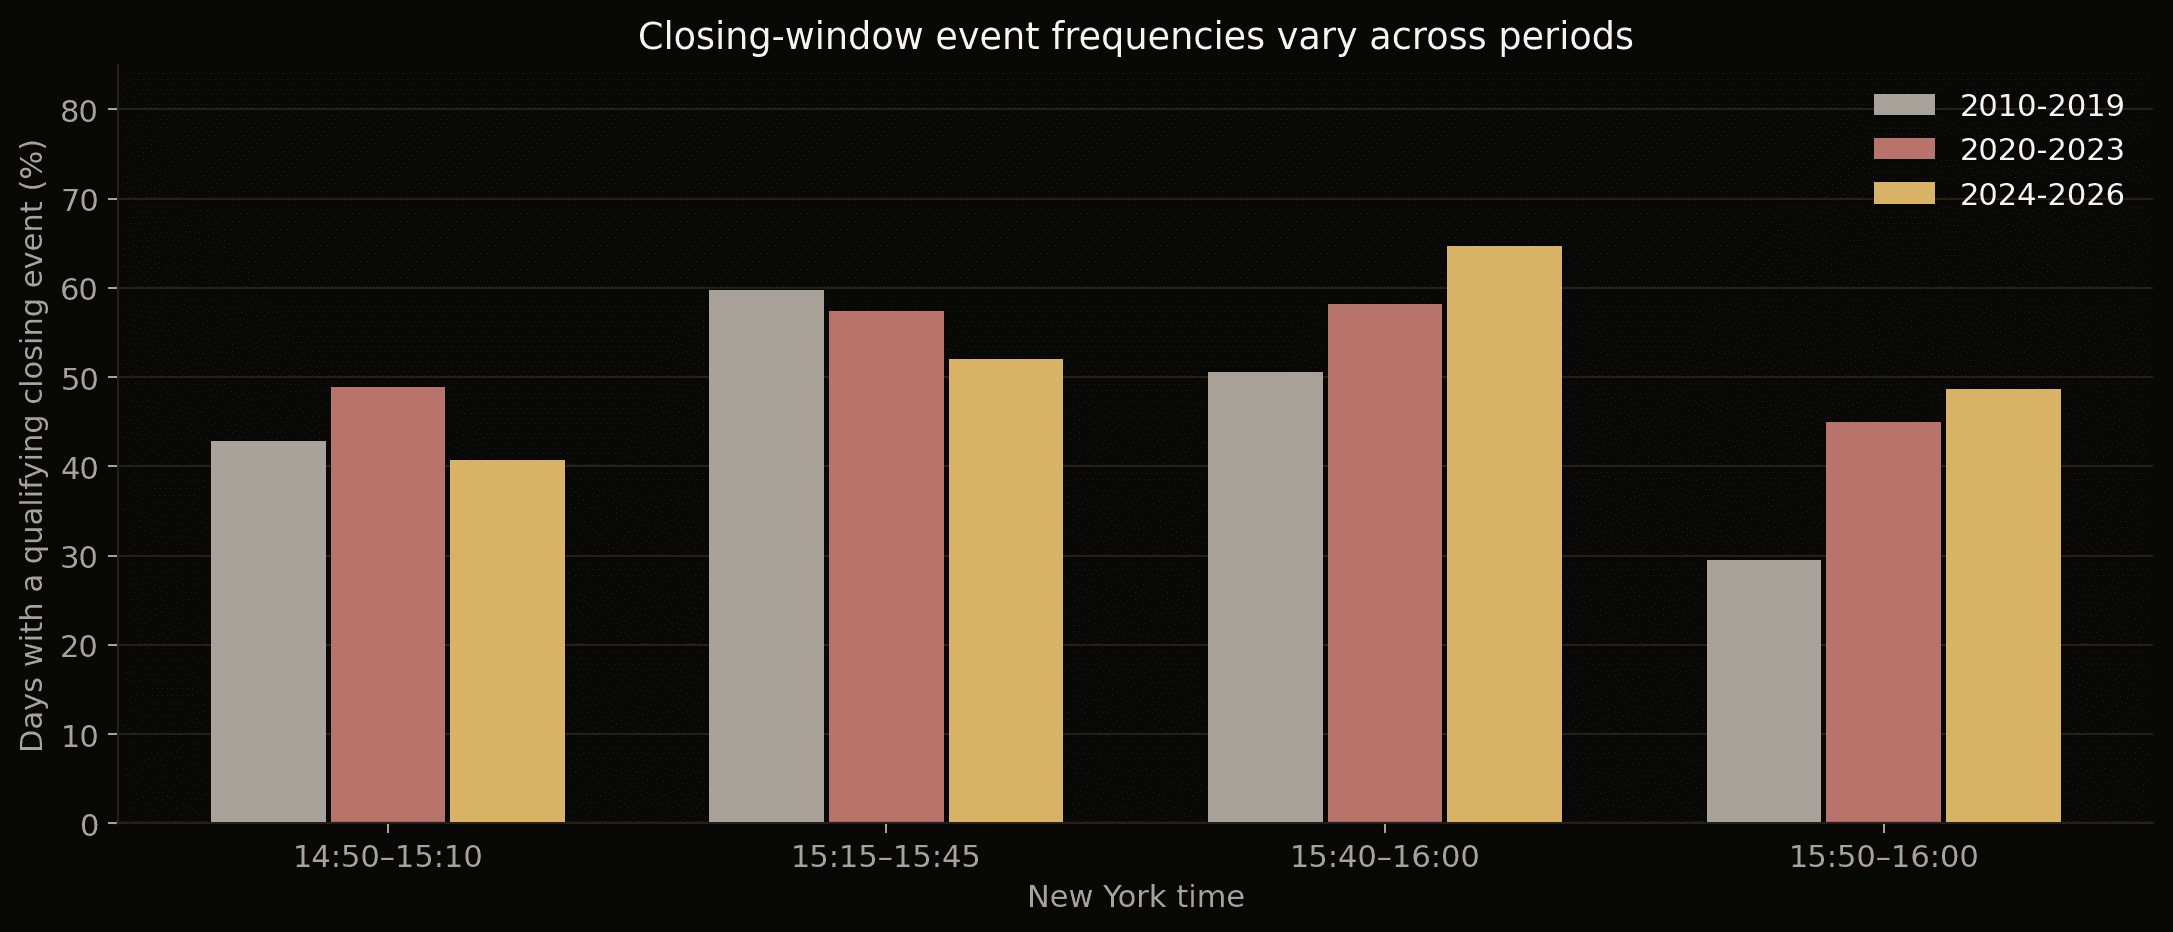
In 2024–2026, event frequencies are 40.67%, 52.00%, 64.67% and 48.67%, respectively. Their historical behavior differs: the final ten-minute window rises from 29.56% in 2010–2019 to 48.67% in 2024–2026, while the 15:15–15:45 window declines from 59.76% to 52.00%.
Does the sequence matter?
In the recent sample:
- The 15:15–15:45 event occurs on 58.15% of days without an earlier 14:50–15:10 event, versus 43.03% with one.
- The 15:40–16:00 event occurs on 74.85% of days without an event in 15:15–15:40, versus 52.55% otherwise.
- The final ten-minute event occurs on 50.98% of days without an event in 15:40–15:50, versus 41.13% otherwise.
Each condition uses only the part of the earlier window already observed when the next window begins.
The raw progression is positive, but an earlier large movement can expand the next reference range, making a later breakout harder by construction. After controlling for range size, efficiency, direction and price position, none of the six period-specific incremental forecasting comparisons survives Holm correction. The sequence is an observable association; an additional forecasting advantage is not robustly established by these controls.
A quiet final approach also does not guarantee a volatility burst. We classify 15:40–15:50 as quiet when its range is no more than half the preceding thirty-minute range and its net displacement no more than one quarter. A burst requires at least twice the previous thirty-minute mean squared one-minute log return. In 2024–2026, bursts occur after 43.06% of quiet intervals, compared with 65.13% of the other intervals.
What the results imply for using macros
The strongest descriptive result is that a qualifying hourly delivery origin frequently occurs inside the macro, and that this concentration recurs over time. The hour matters: the 10:00 candle combines frequent in-window origins with substantial delivered distance, whereas the 09:00 candle often delivers a large move from an origin outside its earlier macro.
The boundary evidence suggests treating a macro as a time interval of interest rather than an exact minute at which a move must begin. Qualifying structure also appears just before and after it, sometimes within the same move.
Session information adds another layer. Completed ranges provide a modest amount of information about subsequent breakout behavior, but the contribution varies across sessions and years. Neither a preceding consolidation nor a macro without a breakout creates a reliable universal expectation of compensation.
Together, these observations give macros a measurable role in describing intraday price development. They do not make timing alone a complete explanation of the path that follows.
Limitations
- The origin is an operational definition. Swing rules, delivery thresholds and the start of the candidate search affect which origin is selected. The headline percentage is conditional on those choices.
- Historical coverage is uneven. Earlier overnight observations are sparse, and incomplete windows are excluded. Missingness may favor more active periods.
- The analysis is exploratory. Multiple hypotheses and sensitivity checks use the same historical periods. Chronological model evaluation is not an untouched prospective confirmation of the entire research program.
- Controls are informative but incomplete. The simulated random walk is not a full NQ model; shifted windows overlap and cross scheduled market events. The session comparison uses one generic rolling-range control.
- ICT concepts are broader than these measurements. Liquidity objectives, discretionary bias and full price-array context are not encoded by the swing and range definitions used here.
- Predictive gains are small and heterogeneous. Relative forecast improvement does not ensure calibrated probabilities: in the matched 2024 sample, the combined model predicts 38.27% on average against 42.39% observed breakouts.
- The scope is NQ price structure. No entry-and-exit strategy, transaction costs or realized trading performance is evaluated.
Conclusion
The replication places 73.27% of eligible first hourly origins inside the macro, with closely similar figures over five- and three-year horizons. That result is the foundation of the study: hourly delivery has a recurring temporal structure under an explicit, reproducible definition.
The extensions make the interpretation more precise. Origin timing and delivered distance vary sharply by hour. Qualifying swings occur immediately outside the boundaries in every observed year. The first-origin percentage depends on how far back the search begins, while valid in-window swings remain common when earlier candidates are admitted.
The surrounding session contributes modest predictive information, but there is no general evidence that one inactive window must be compensated by the next. Closing-window associations likewise require attention to the ranges used to define their events.
Macros are therefore useful objects of empirical study: recurring windows whose behavior can be measured by hour, context and period, rather than assumed to be identical throughout the trading day.
Sources
- Petar, What 10 years of NQ data say about ICT hourly macros. Source of the hourly-origin replication question.
- Trader Round Up — Mentorship with Michael, August 15, 01:43:27–01:45:49: ordinary hourly macros. 01:01:21–01:07:41: previous-session ranges.
- In the Market, August 26, 01:10:44–01:16:11: closing windows and their proposed progression. These teaching passages motivate the hypotheses; the numerical event definitions are specified in this study.
Updated September 30, 2026: added the historical data source to the methodology.
For questions, feedback, or further information about these studies, contact research@thehermestrader.com.
Related articles
NQ Weekly Profile Research: What 16 Years of Data Reveals
An empirical study of 769 non-roll NQ weeks maps when weekly extremes form, which price paths recur, and what Friday's close suggests about the following week.
Can We Forecast the Next NQ Liquidity Target?
A three-window study of the first NQ liquidity pool reached in New York trading. A frozen directional model was accurate on selected forecasts, but did not outperform the nearest active pool on the same events.
NQ Overnight Returns: Historical Drift, Execution Costs and Capital Requirements
An NQ overnight-return study covering 2010–2025, with MNQ execution, risk and capital estimates. The selected rules failed internal validation; their partial 2026 results do not establish a stable net edge.