NQ Weekly Profile Research: What 16 Years of Data Reveals
An empirical study of 769 non-roll NQ weeks maps when weekly extremes form, which price paths recur, and what Friday's close suggests about the following week.
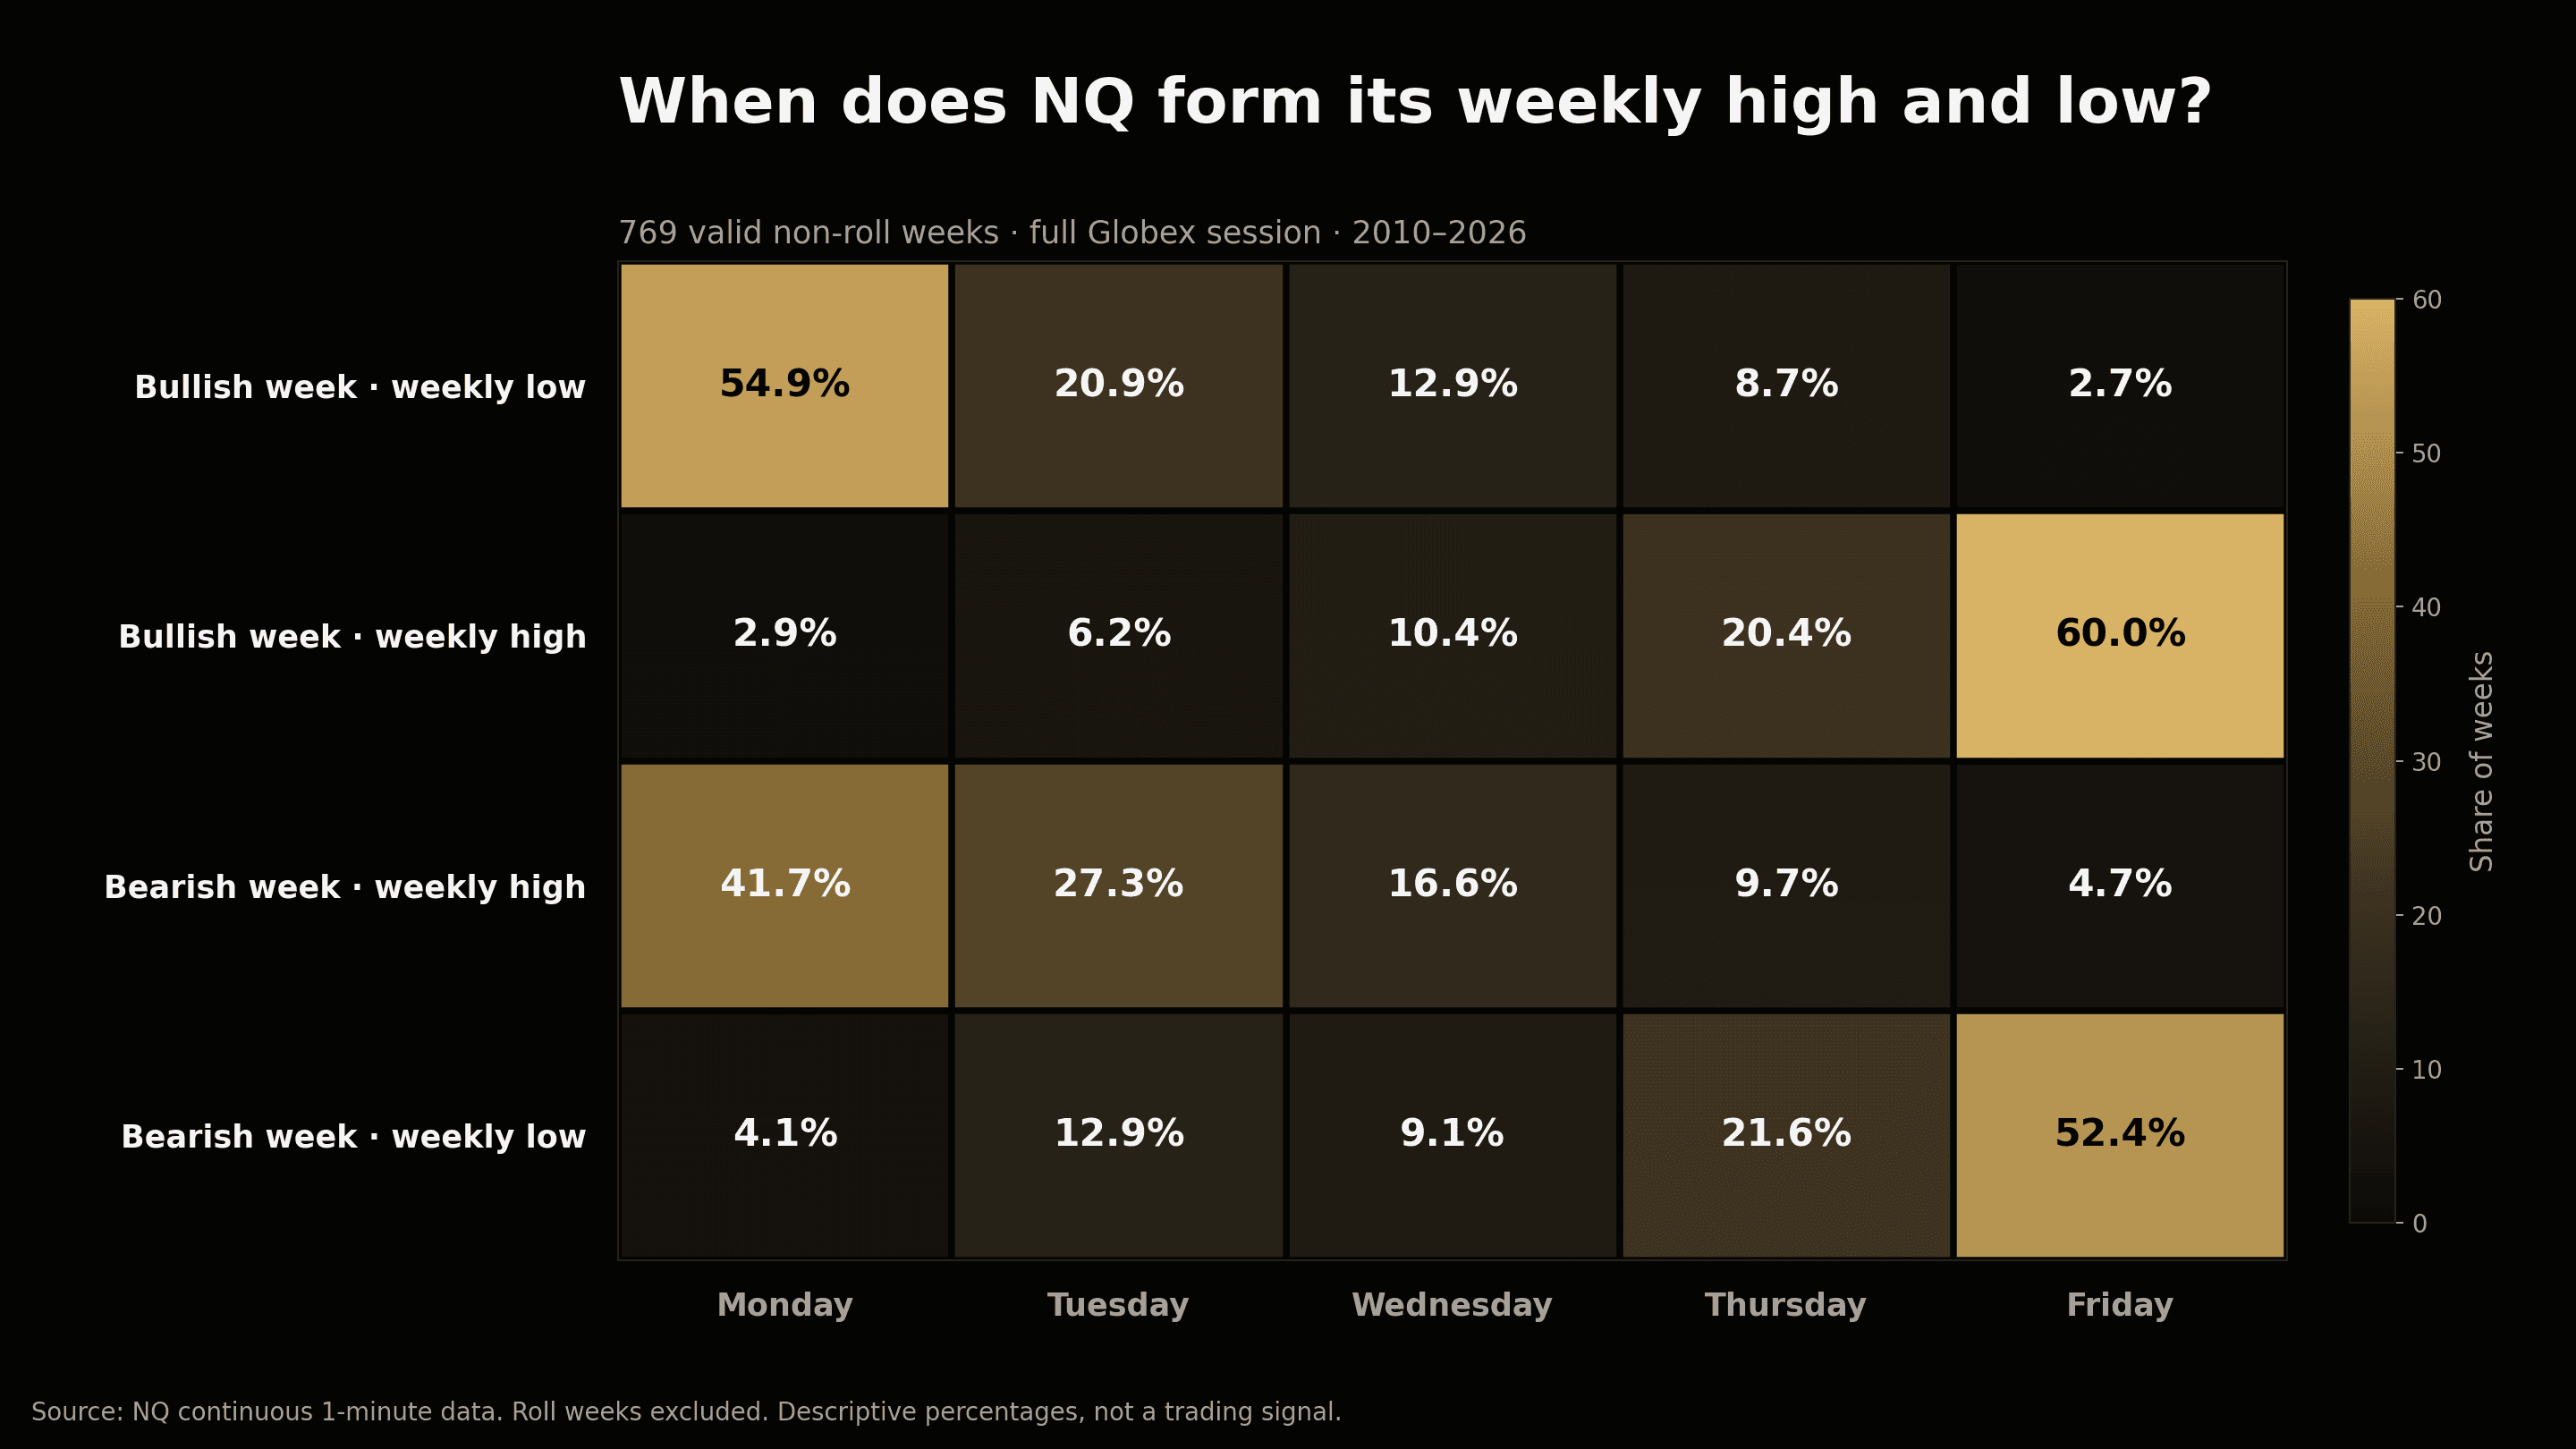
Table of contents
- Methodology
- Research scope
- The data
- The basic weekday result
- Bullish weeks
- Bearish weeks
- An exhaustive weekly-profile taxonomy
- The most common exact paths
- Is the taxonomy stable?
- Does one profile predict the next profile?
- But the terminal extreme contains useful information
- What happens after Friday closes near the weekly high?
- What happens after Friday closes near the weekly low?
- How this can help trading
- 1. Describe the current week
- 2. Update the remaining weekly path
- 3. Prepare for the next week
- Relationship to the ICT profiles
- Limitations
- Conclusion
- Sources and further reading
Bottom line first: the most common weekly profile in NQ was not Classic Tuesday Low, Wednesday Reversal, or Friday Seek & Destroy.
It was much simpler:
The directional extreme formed on Monday, and the opposite weekly extreme formed on Thursday or Friday.
That Monday-Anchored Expansion family occurred in 303 of 769 valid weeks, or 39.40% of the complete sample.
The single most frequent exact path was:
Bullish week · Monday low → Friday high
It occurred 145 times: 18.86% of every valid week and 32.22% of bullish weeks.
The broader lesson is that weekly-profile research becomes most useful when every observed week is described objectively, then tested for frequency, stability, transitions, and practical relevance.
That is what this study does.
Methodology
Research scope
The starting point was ICT's lesson on Short-Term Trading and Defining Weekly Range Profiles:
ICT — Short-Term Trading: Defining Weekly Range Profiles
The lesson presents several recurring weekly structures:
- Classic Tuesday Low and High;
- Wednesday Low and High;
- Consolidation Midweek Rally and Decline;
- Thursday Reversal;
- Friday Seek & Destroy;
- Wednesday Weekly Reversal.
This study extends that framework into a complete empirical map of NQ weekly price paths. The research questions were:
- In bullish weeks, when do the weekly low and high form?
- In bearish weeks, when do the weekly high and low form?
- Which exact weekly paths occur most often?
- Can every week be assigned to an observable family?
- Are those families stable across time?
- Does the current profile say anything about the following week?
- If Friday closes near the weekly high or low, what happens next?
The data
The historical market data used in this study was obtained from Databento.
The sample contains:
- NQ continuous futures;
- 1-minute data;
- the complete Globex trading day starting at 18:00 New York;
- June 2010 through June 2026;
- 4,124 daily sessions;
- 836 observed weeks;
- 769 valid non-roll weeks;
- 450 bullish weeks;
- 319 bearish weeks.
Roll weeks were excluded from the primary sample so that contract gaps could not become false weekly highs, lows, sweeps, or expansions.
There are 705 valid consecutive-week transitions for the next-week analysis.
This is still a structure study, not a complete strategy backtest. There are no entry, stop, slippage, or PnL claims below.
The basic weekday result
Bullish weeks
The weekly low formed on:
- Monday: 54.89%
- Tuesday: 20.89%
- Wednesday: 12.89%
- Thursday: 8.67%
- Friday: 2.67%
The weekly high formed on:
- Monday: 2.89%
- Tuesday: 6.22%
- Wednesday: 10.44%
- Thursday: 20.44%
- Friday: 60.00%
The bullish weekly low was established by Tuesday close in 75.78% of cases and by Wednesday close in 88.67%.
Bearish weeks
The weekly high formed on:
- Monday: 41.69%
- Tuesday: 27.27%
- Wednesday: 16.61%
- Thursday: 9.72%
- Friday: 4.70%
The weekly low formed on:
- Monday: 4.08%
- Tuesday: 12.85%
- Wednesday: 9.09%
- Thursday: 21.63%
- Friday: 52.35%
The bearish weekly high was established by Tuesday close in 68.97% of cases and by Wednesday close in 85.58%.
The directional extreme usually forms early. The terminal extreme usually forms late. That general observation is stronger than any one named template.
An exhaustive weekly-profile taxonomy
Each valid week is classified from two observable facts:
- Directional extreme: the low in a bullish week or high in a bearish week.
- Terminal extreme: the high in a bullish week or low in a bearish week.
The weekday of those two extremes creates an exact price path. The 769 valid weeks produced 49 observed exact paths.
Those paths were grouped into five mutually exclusive families:
- Monday-Anchored Expansion: directional extreme Monday, terminal extreme Thursday or Friday.
- Tuesday Turn Expansion: directional extreme Tuesday, terminal extreme Thursday or Friday.
- Wednesday Turn Expansion: directional extreme Wednesday, terminal extreme Thursday or Friday.
- Early Range Completed: both extremes form between Monday and Wednesday.
- Late Directional Extreme: the directional extreme does not form until Thursday or Friday.
Every valid week receives exactly one family.
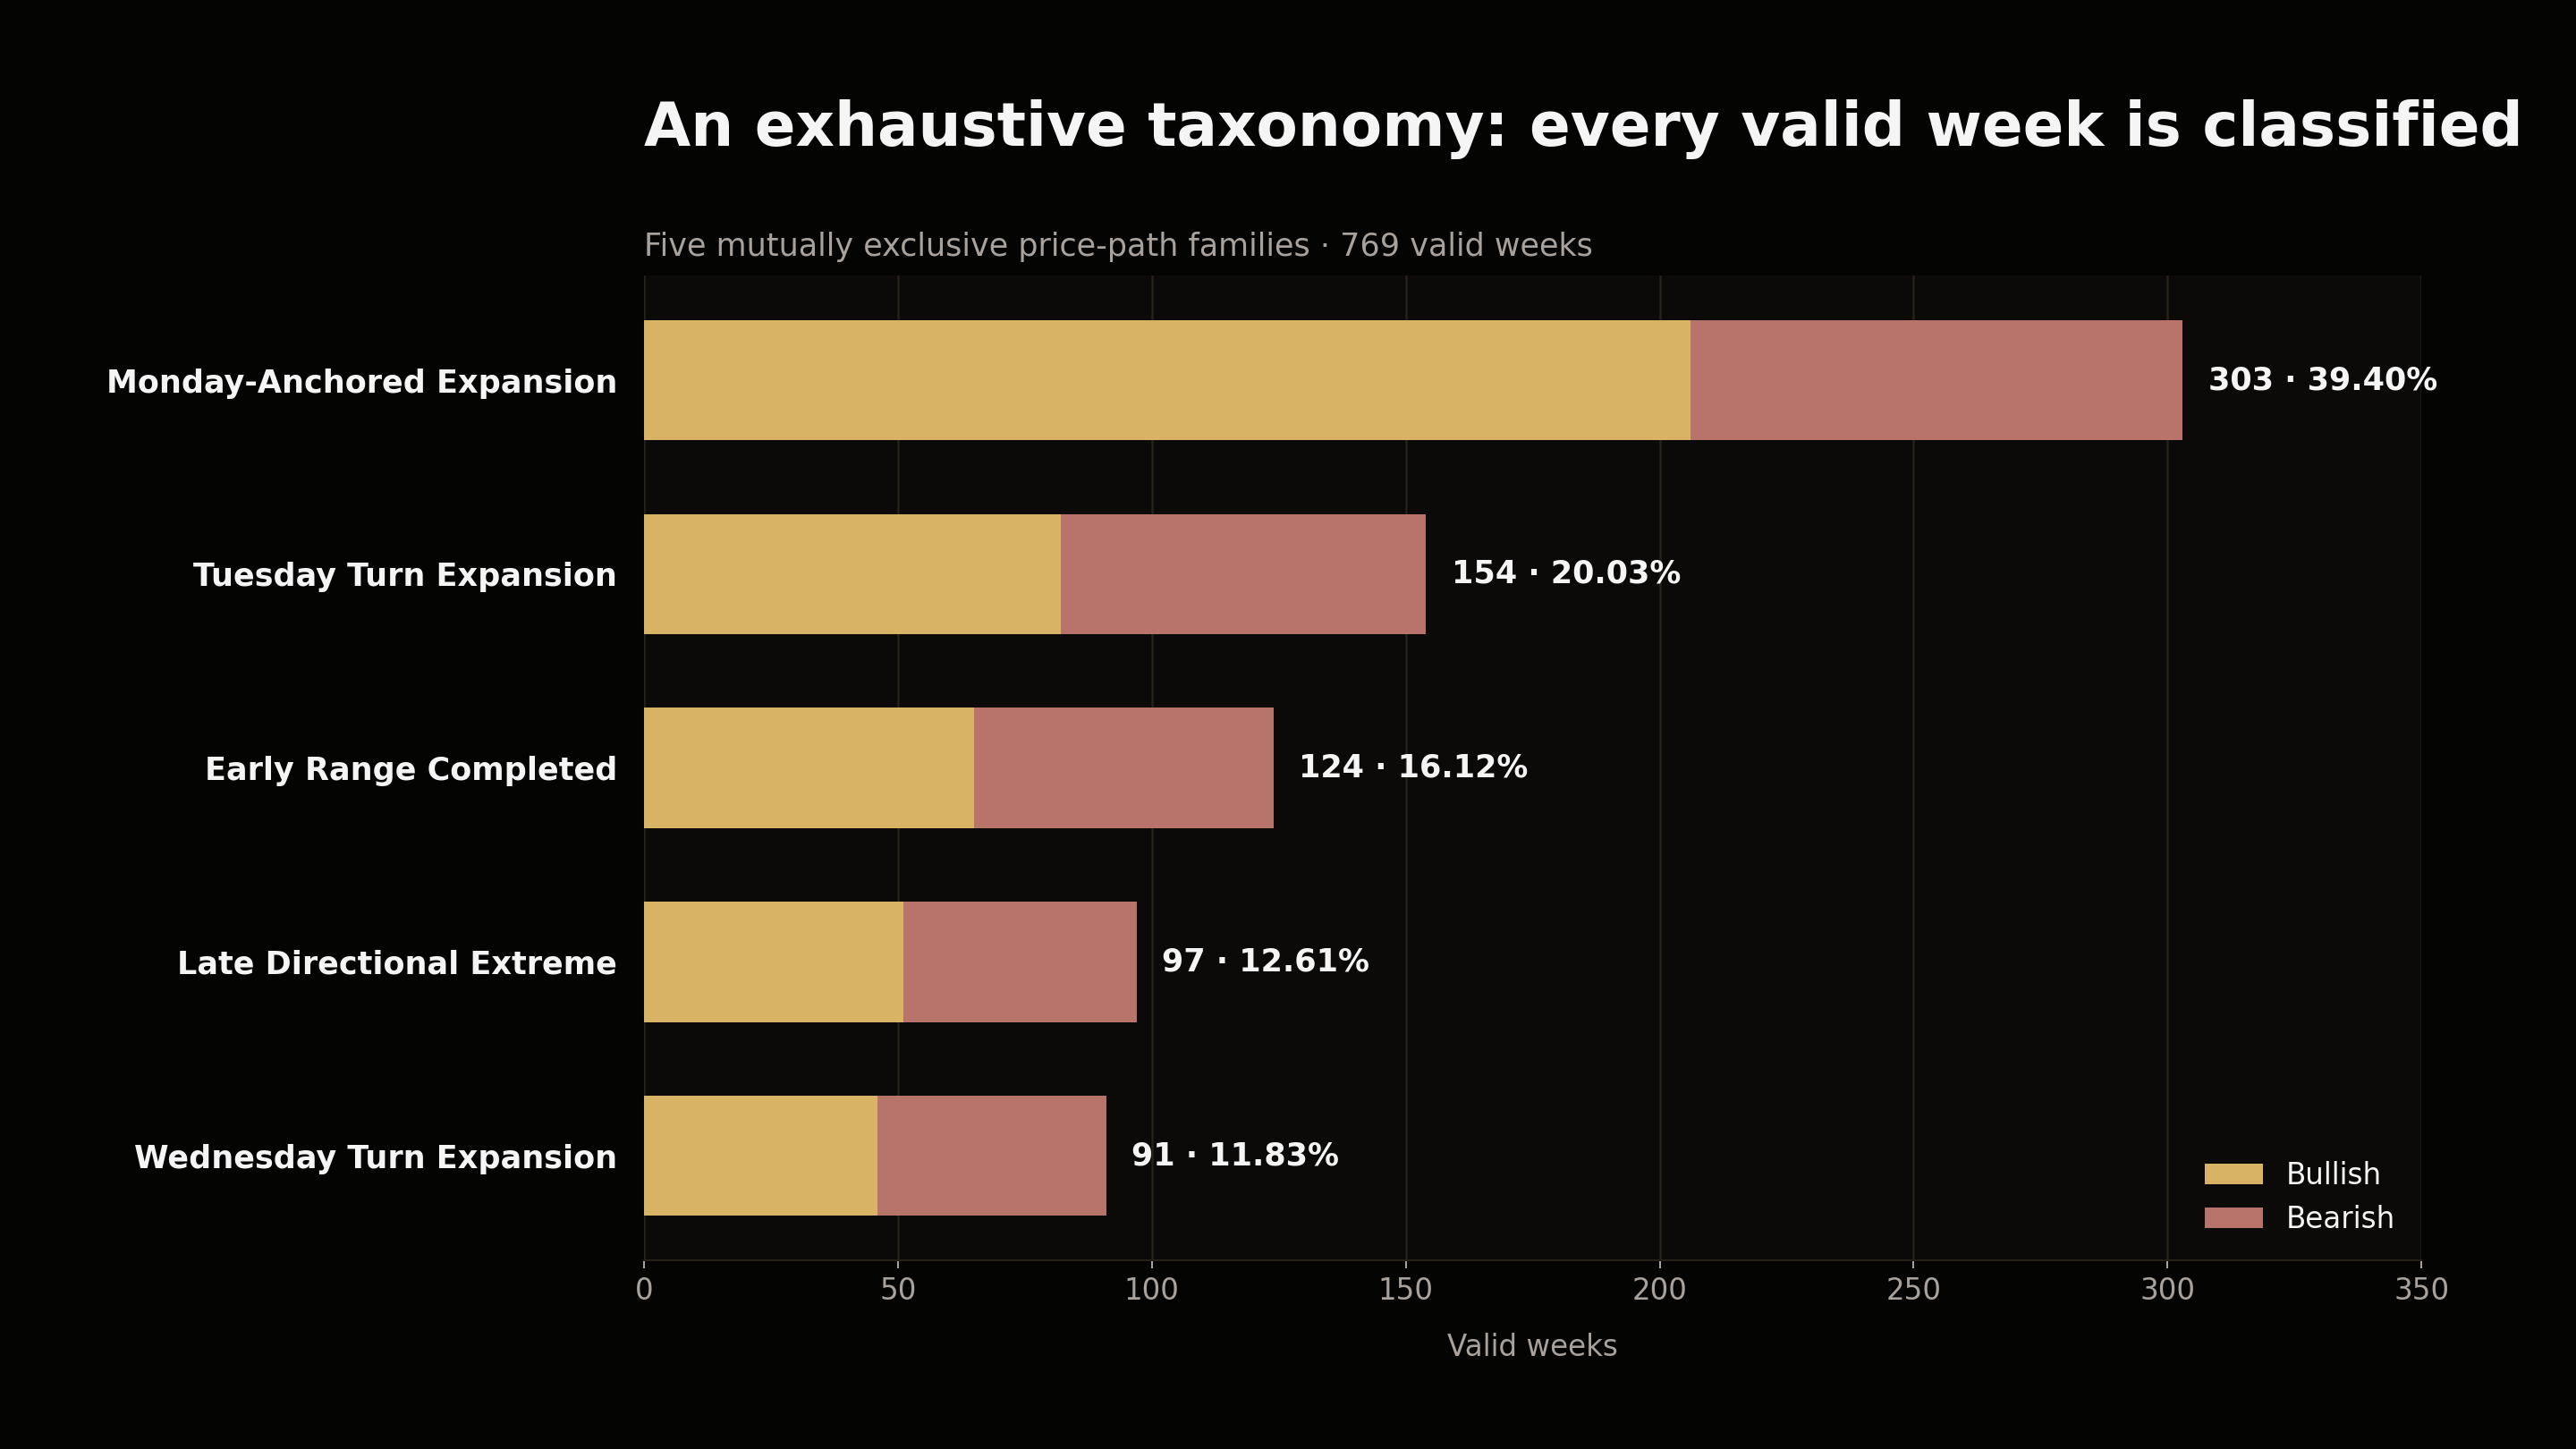
The frequencies were:
- Monday-Anchored Expansion: 303 weeks, 39.40%;
- Tuesday Turn Expansion: 154 weeks, 20.03%;
- Early Range Completed: 124 weeks, 16.12%;
- Late Directional Extreme: 97 weeks, 12.61%;
- Wednesday Turn Expansion: 91 weeks, 11.83%.
Together, these five families cover all 769 valid weeks in the sample.
The most common exact paths
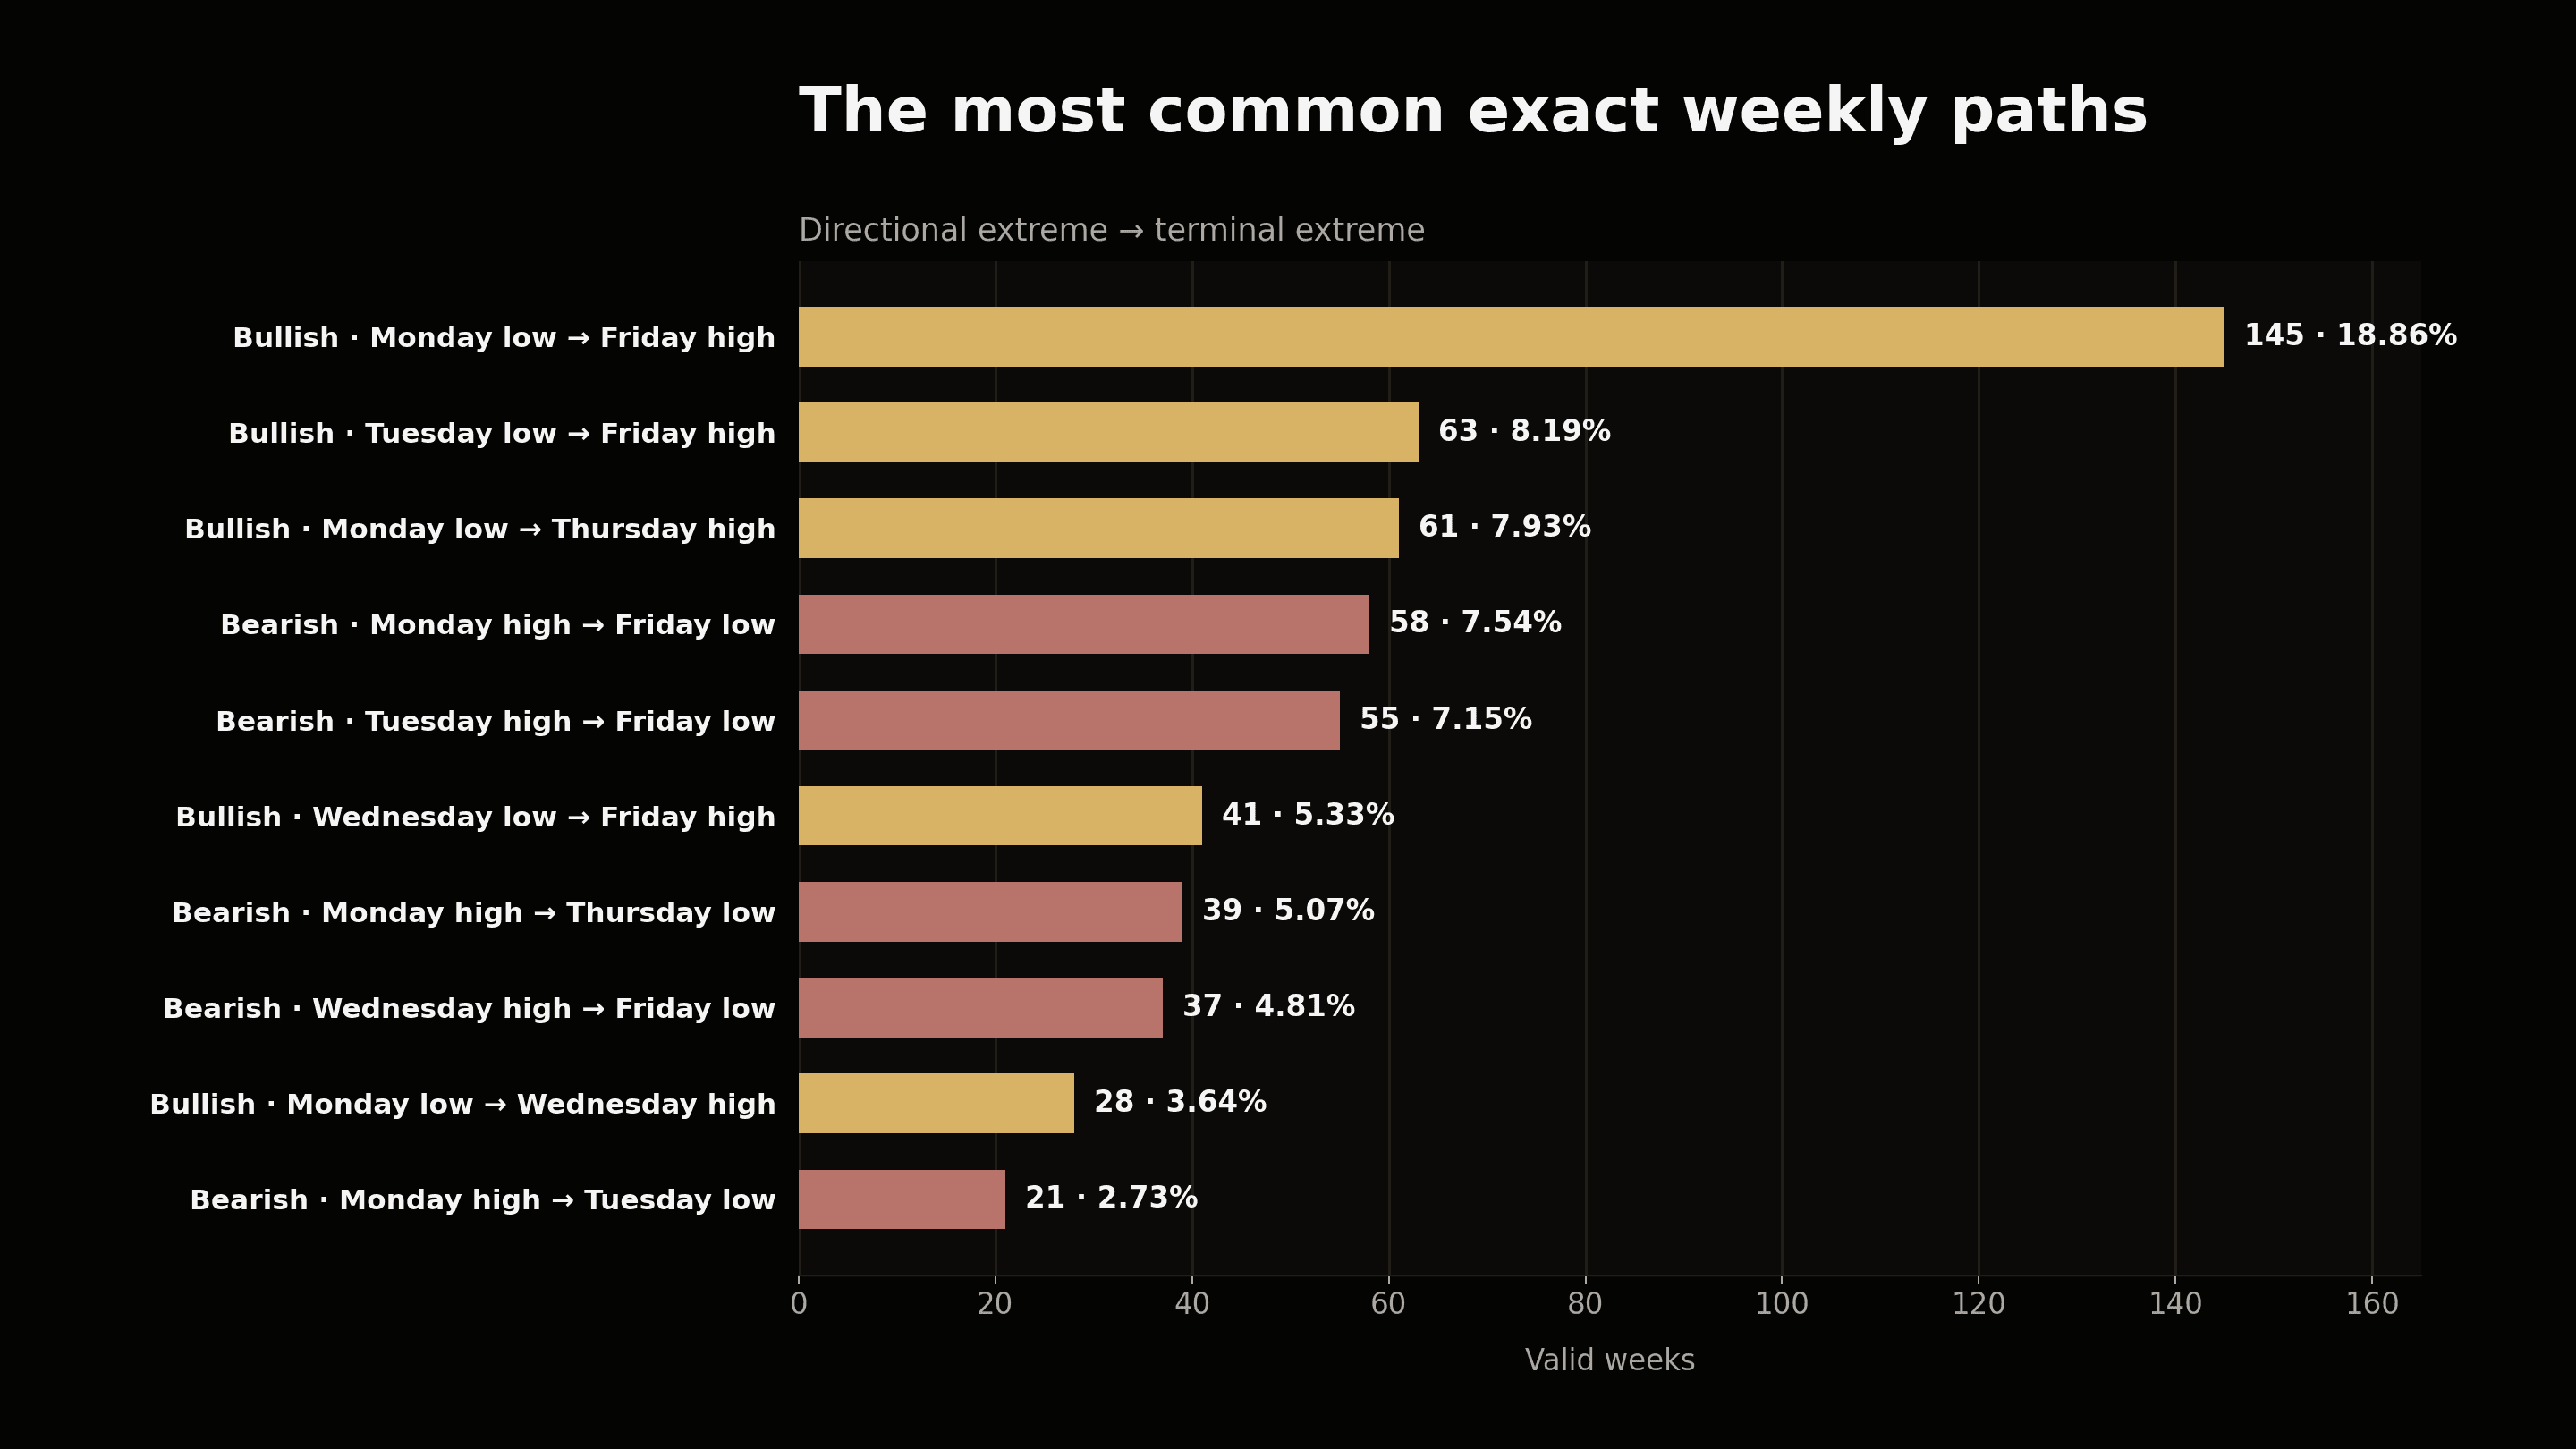
The leading paths were:
- Bullish Monday low → Friday high: 145 cases, 18.86%.
- Bullish Tuesday low → Friday high: 63 cases, 8.19%.
- Bullish Monday low → Thursday high: 61 cases, 7.93%.
- Bearish Monday high → Friday low: 58 cases, 7.54%.
- Bearish Tuesday high → Friday low: 55 cases, 7.15%.
- Bullish Wednesday low → Friday high: 41 cases, 5.33%.
- Bearish Monday high → Thursday low: 39 cases, 5.07%.
- Bearish Wednesday high → Friday low: 37 cases, 4.81%.
The next chart translates the six leading bullish and bearish paths into simple visual templates. Each line passes through the weekdays that define the weekly low and high, making the structure immediately visible.
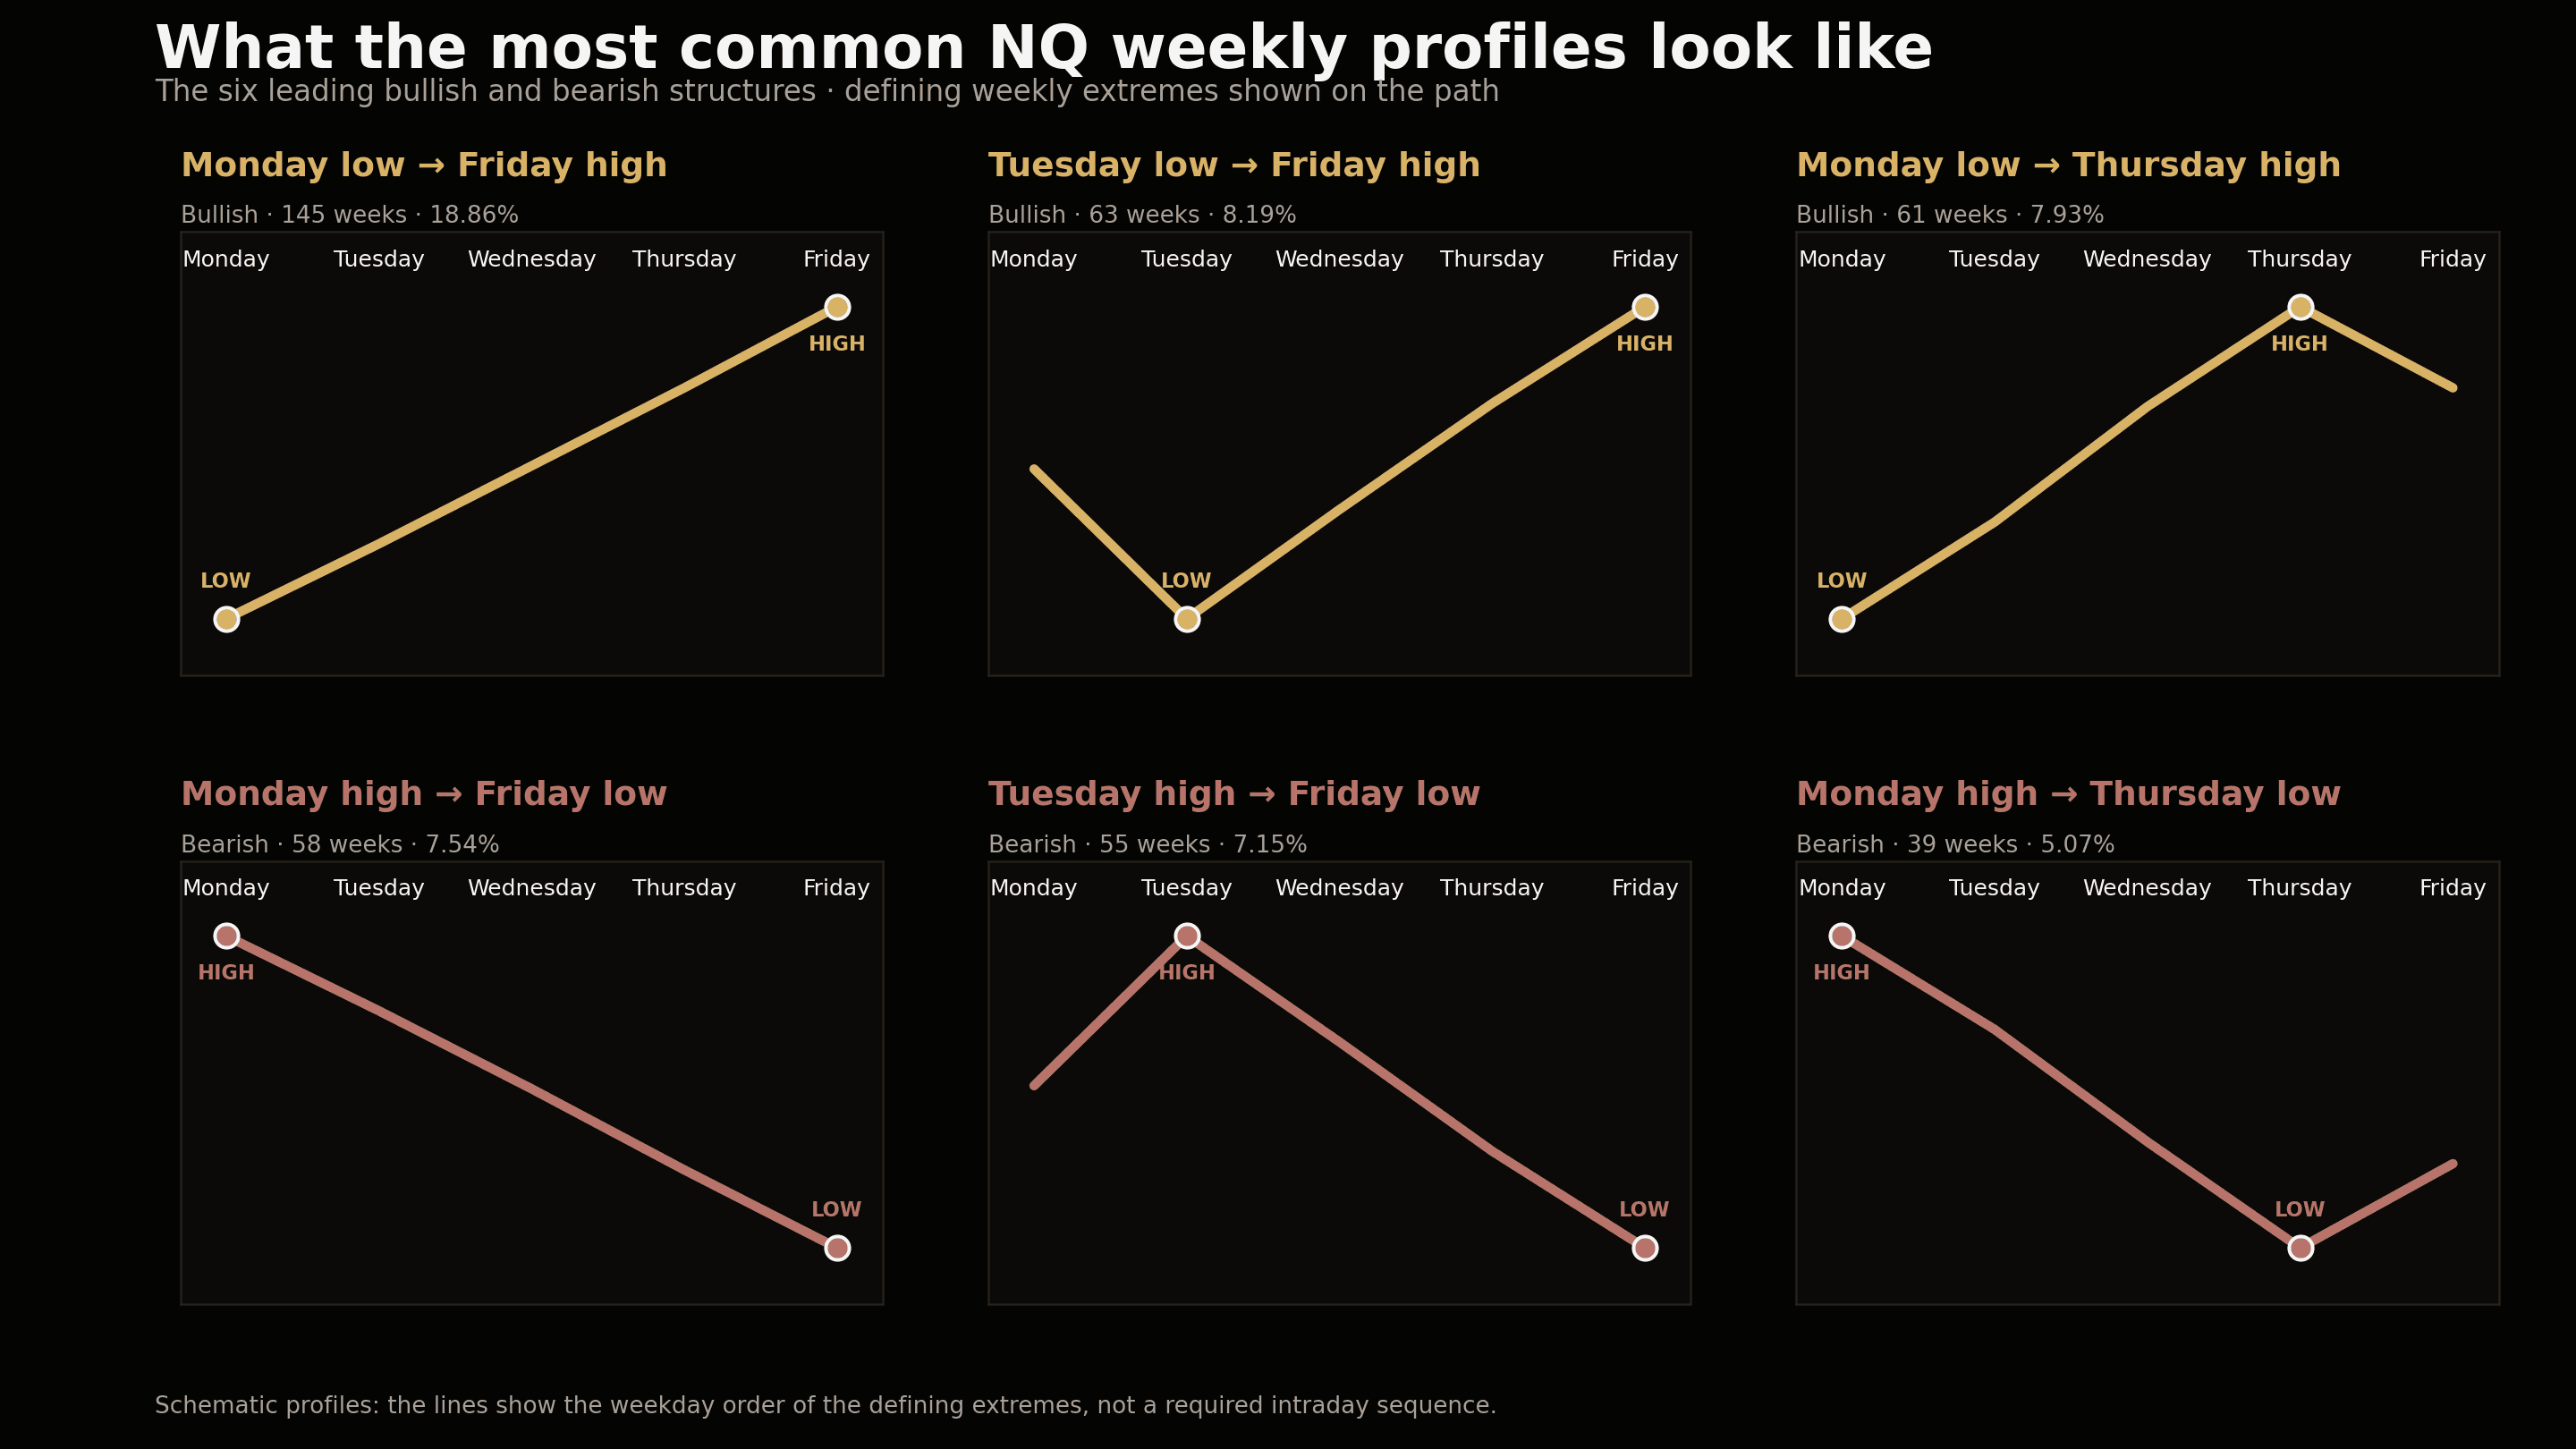
These are schematics, not sequences price must follow. Their purpose is to show the defining weekday structure; the occurrence counts and percentages come from the observed sample.
The classic Tuesday and Wednesday structures are present. They are simply part of a larger distribution where Monday-anchored paths are more common.
Is the taxonomy stable?
Yes. Family frequencies changed very little across three eras:
| Family | 2010–2014 | 2015–2019 | 2020–2026 |
|---|---|---|---|
| Monday-Anchored Expansion | 40.55% | 38.17% | 39.55% |
| Tuesday Turn Expansion | 21.20% | 19.92% | 19.29% |
| Early Range Completed | 14.75% | 16.60% | 16.72% |
| Late Directional Extreme | 12.44% | 13.69% | 11.90% |
| Wednesday Turn Expansion | 11.06% | 11.62% | 12.54% |
Monday-Anchored Expansion remained close to 40% in every period. This does not look like a short-lived regime artifact.
Does one profile predict the next profile?
Not strongly.
For example, Monday-Anchored Expansion was followed by another Monday-Anchored week 37.41% of the time. Its unconditional transition rate was 38.58%. There was no persistence advantage.
The largest exploratory transition lifts among the better-sampled families were only around 1.2–1.25:
- Early Range Completed → Tuesday Turn;
- Tuesday Turn → Late Directional Extreme;
- Monday-Anchored → Wednesday Turn.
The current family is therefore not a reliable predictor of the exact family that follows.
But the terminal extreme contains useful information
The family name did not strongly predict the following week's direction. It did help identify which prior extreme was likely to trade again.
Examples:
- After Bullish Monday-Anchored Expansion, the following week broke the current high in 84.46% of 193 transitions.
- After Bearish Monday-Anchored Expansion, it broke the current low in 64.71% of 85 transitions.
- After Bullish Tuesday Turn, it broke the current high in 83.12%.
- After Bearish Tuesday Turn, it broke the current low in 56.72%.
- After Bullish Wednesday Turn, it broke the current high in 90.48%.
- After Bearish Wednesday Turn, it broke the current low in 87.50%.
This is not the same as saying the following weekly candle closes in continuation. A level can trade, sweep, and reverse.
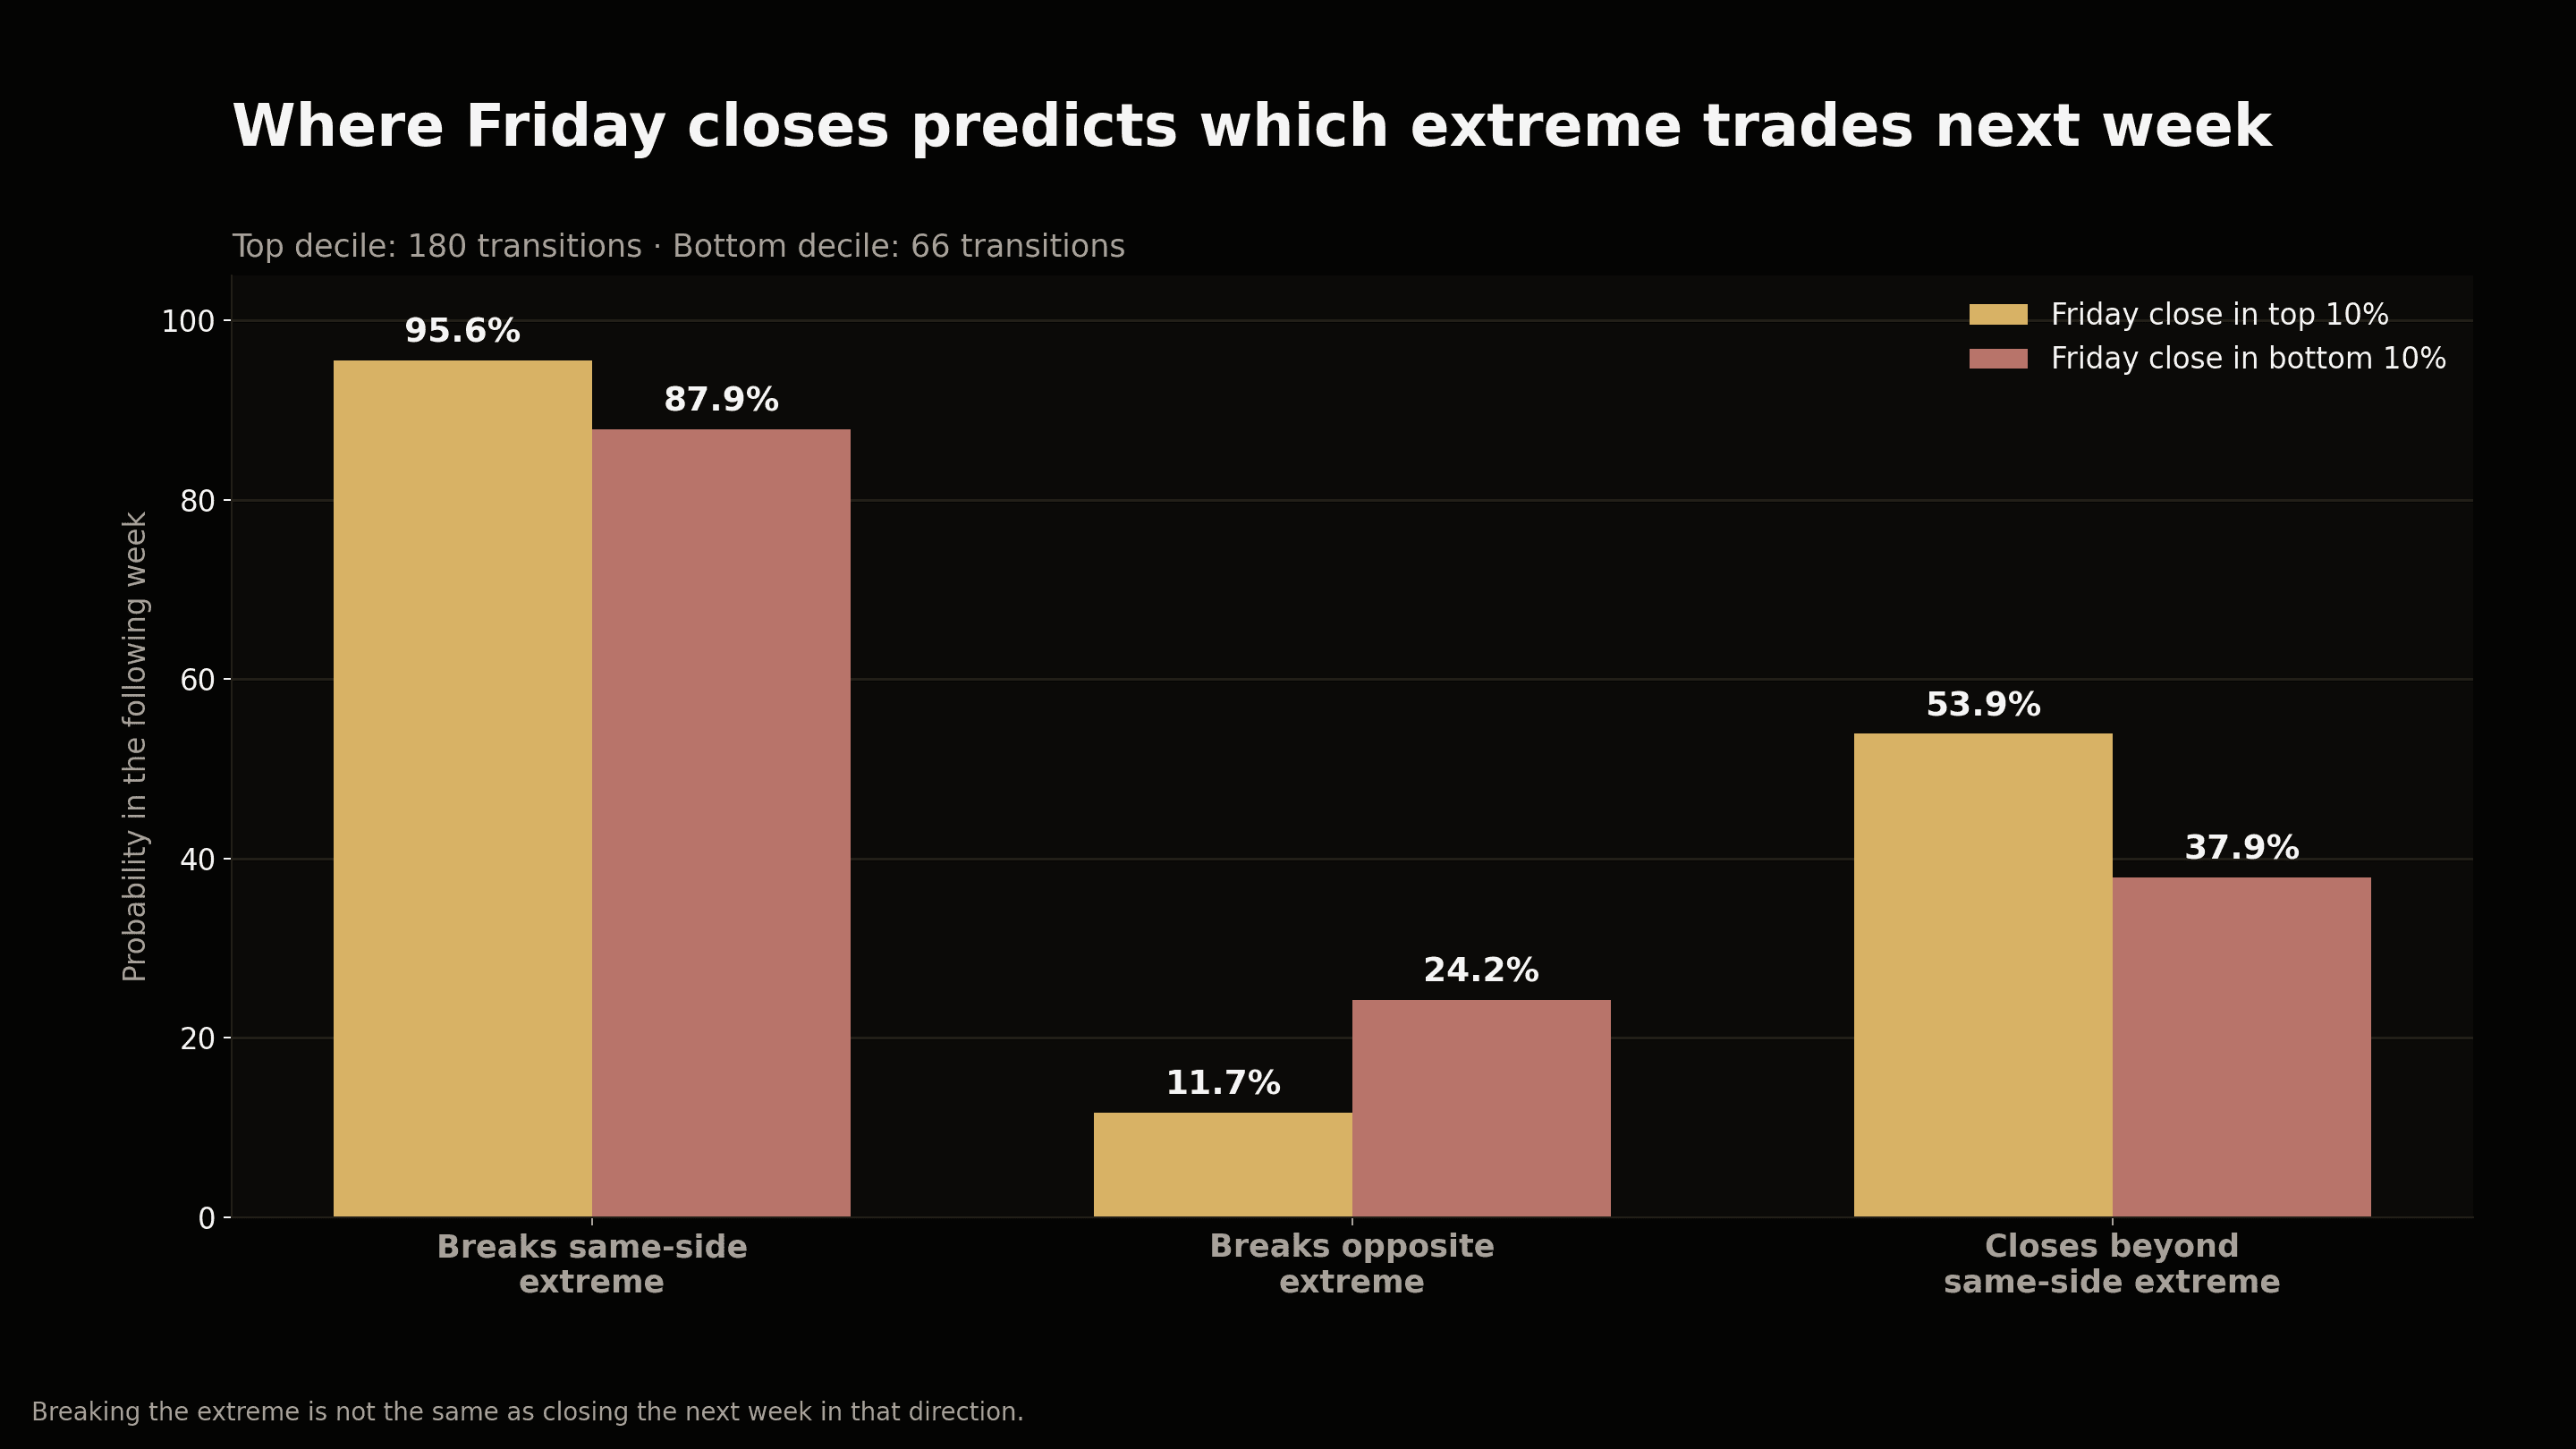
What happens after Friday closes near the weekly high?
“Near” is defined as the top 10% of the weekly range. There were 180 valid transitions.
The following week:
- broke the previous high in 95.56%;
- broke the previous low in 11.67%;
- closed above the previous high in 53.89%;
- was bullish in 58.89%, almost identical to the unconditional 58.72% rate.
When Friday both formed the weekly high and closed near it, the following week broke that high in 96.86% of 159 cases.
The result survived wider definitions:
- Friday close in top 20% → next week broke the high 91.64%;
- Friday close in top 25% → next week broke the high 88.22%.
What happens after Friday closes near the weekly low?
There were 66 transitions with a bottom-decile Friday close.
The following week:
- broke the previous low in 87.88%;
- broke the previous high in 24.24%;
- closed below the previous low in 37.88%;
- was bullish in 62.12%.
That final statistic is important. A Friday close near the low predicts that the low is likely to trade again. It does not imply that the next weekly candle is likely to finish bearish.
The low-break result also persisted with wider thresholds:
- bottom 20% → 82.91%;
- bottom 25% → 82.19%.
How this can help trading
The research suggests three different tasks.
1. Describe the current week
Track the directional and terminal extremes without forcing an ICT label. Ask:
- Has the directional extreme already formed?
- Is the week expanding from Monday, Tuesday, or Wednesday?
- Has the complete range already formed early?
- Is a late directional extreme still developing?
2. Update the remaining weekly path
The weekday distribution gives a prior for whether the directional extreme is likely protected. This can help frame targets and invalidations, but it is not an automatic entry signal.
3. Prepare for the next week
Friday's closing location provides a strong clue about which prior extreme will trade again. The correct question is not necessarily:
Will next week be bullish or bearish?
It may be:
Which side is highly likely to be accessed before the next weekly path is complete?
That distinction is more useful for liquidity-based planning.
Relationship to the ICT profiles
The named ICT profiles can be located within this broader empirical map:
- Classic Tuesday profiles sit inside Tuesday Turn Expansion.
- Wednesday Low/High profiles sit inside Wednesday Turn Expansion.
- Some Midweek Rally/Decline weeks overlap Monday-Anchored or early-completed structures depending on the exact extreme days.
- Thursday Reversal belongs mainly inside Late Directional Extreme.
- Seek & Destroy requires additional consolidation and two-sided-stop behavior beyond the weekday path.
The weekday-path families provide the broad classification layer; the named profiles add more specific sequence and market-context conditions within it.
Limitations
- This is NQ, not a cross-asset validation.
- Continuous futures are appropriate for structure research but not execution modeling.
- The five families intentionally summarize weekday paths; they do not claim to encode every intraday sequence.
- Friday bottom-decile closes have a smaller sample than top-decile closes.
- Transition findings require execution-level testing before becoming a trading model.
- Breaking an extreme does not mean accepting or closing beyond it.
Conclusion
Weekly extremes do form in recurring sequences. Across the complete sample, the dominant NQ structure is Monday-Anchored Expansion, not a delayed Tuesday or Wednesday reversal.
The most actionable new finding is the relationship between Friday's closing location and the following week's accessible liquidity:
- Friday near the high → the high trades again 95.56%;
- Friday near the low → the low trades again 87.88%.
That does not tell us where the following week will close. It tells us which extreme is highly likely to matter.
The practical research process is straightforward: classify every week, measure the path, study transitions, and then test explicit trading rules.
Sources and further reading
Updated September 30, 2026: added the historical data source to the methodology.
For questions, feedback, or further information about these studies, contact research@thehermestrader.com.
Related articles
Can We Forecast the Next NQ Liquidity Target?
A three-window study of the first NQ liquidity pool reached in New York trading. A frozen directional model was accurate on selected forecasts, but did not outperform the nearest active pool on the same events.
ICT Macros in NQ: When Hourly Moves Begin
An empirical study of NQ hourly origins, timing boundaries, session context and closing windows, separating recurring price structure from predictive value.
NQ Overnight Returns: Historical Drift, Execution Costs and Capital Requirements
An NQ overnight-return study covering 2010–2025, with MNQ execution, risk and capital estimates. The selected rules failed internal validation; their partial 2026 results do not establish a stable net edge.