Can We Forecast the Next NQ Liquidity Target?
A three-window study of the first NQ liquidity pool reached in New York trading. A frozen directional model was accurate on selected forecasts, but did not outperform the nearest active pool on the same events.
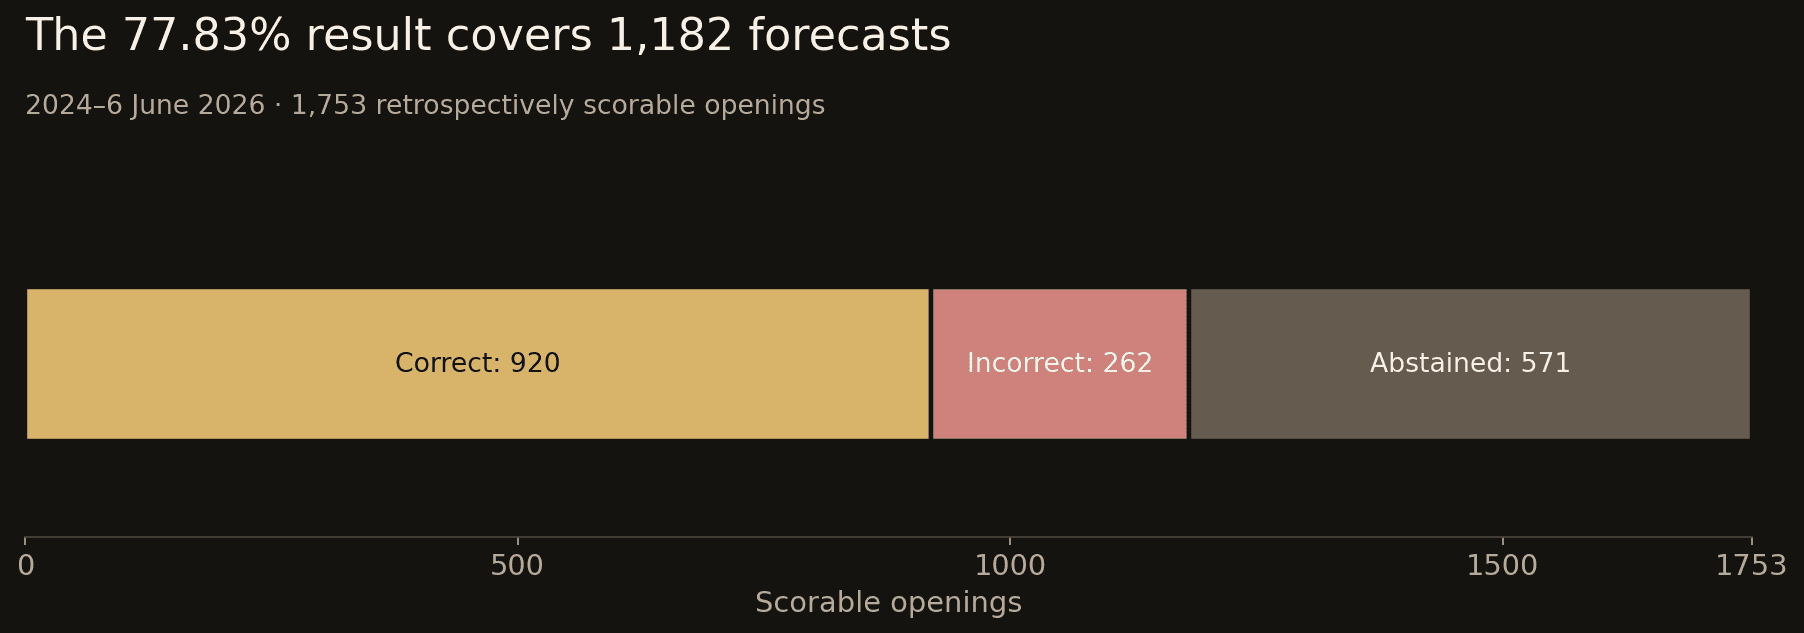
Table of contents
Can the next liquidity pool reached by NQ be anticipated at the opening of a New York trading window?
The frozen retrospective confirmation covering January 2024 through 6 June 2026 constructed 1,832 window events. In 79, the same one-minute bar first touched multiple pools on the same side, so the first pool could not be identified. The prespecified scoring rule excluded those events, leaving 1,753 scorable openings. The model issued forecasts on 1,182 of them and identified the first pool reached on 920: 77.83% accuracy at 67.43% coverage within the scorable subset. It abstained on the other 571 scorable openings.
On exactly the same 1,182 openings, a rule that selected the nearest active liquidity pool also identified the first pool reached 920 times. That nearest-pool rule scored 67.77% across all 1,753 scorable openings. The selected subset was easier for this simple rule in this sample; the study did not test whether the model selects better than a distance-based filter at the same coverage.
The question and its boundary
The question is not where NQ eventually closes, nor whether it reaches a particular level at some point later in the week. At 09:30, 11:30 and 13:30 New York time, we ask which still-active liquidity pool will be touched first before the end of that trading window. The corresponding horizons end at 11:30, 13:30 and 16:00. A forecast made for NY AM does not carry into Lunch.
Here, a liquidity pool is a cluster of historical price levels used as a proxy for potential liquidity. The study does not observe resting orders at those prices. A high or low is not counted because it looks important after the fact. It must already exist at the decision time, remain unconsumed, and be reached within the specified horizon. If no eligible pool is reached, the observed outcome is NONE. If one one-minute bar touches competing pools and their order cannot be determined from OHLC data, the event is not given an invented first-touch label.
The inventory comprises the highs and lows of the current day’s completed Asia, London and premarket intervals; the most recent completed NY AM, Lunch and NY PM windows; the highs and lows of the preceding three completed regular sessions; and confirmed 15-minute relative equal highs or lows. Two same-side levels within four NQ points are grouped as one pool. Opposite-side levels are never merged. A level ceases to be eligible after its first qualifying one-tick raid, expiry, or an incompatible contract change.
For example, a London high close to a confirmed equal high is one upper pool, not two independent targets. The model has to choose between that upper side, a lower pool, or no sufficiently clear direction. It cannot use a high discovered later in the same window.
How the forecast was made
The historical market data used in this study was obtained from Databento.
We used one-minute NQ continuous-futures bars and New York local time, including daylight-saving changes. Features were constructed from information available at the opening of each window: the active pool inventory, relative distances, prior range context, and the window itself. Future bars were used only to assign outcomes.
The classifier was a multinomial logistic regression trained to estimate HIGH, LOW and NONE. A fresh model was fitted once on 2016–2020. 2021–2023 was the validation interval. Before looking at the 2024–6 June 2026 confirmation results, the specification was frozen: C=1, no class weights, a minimum winning probability of 0.60, and a minimum 0.10 advantage over the strongest competing outcome. Otherwise it abstained.
After choosing HIGH or LOW, the procedure selected the nearest still-active pool on that side. It did not estimate a separate probability for every individual pool. This distinction matters when interpreting the result: side choice and exact-pool choice are not two independently demonstrated abilities. Given this inventory, the first reachable pool on the correct side is normally the nearest one on that side.
The confirmation was retrospective and frozen, not a prospective test. Pool ideas and parts of the later data had already been inspected in earlier research. Freezing the model prevents adjustment after seeing this particular result; it does not erase that prior exposure.
Results across the three periods
| Period | Scorable openings | Forecasts issued | Coverage | Correct when forecasting |
|---|---|---|---|---|
| 2016–2020 training | 3,715 | 2,333 | 62.80% | 77.28% |
| 2021–2023 validation | 2,173 | 1,465 | 67.42% | 78.36% |
| 2024–6 June 2026 confirmation | 1,753 | 1,182 | 67.43% | 77.83% |
The confirmation rate is 920/1,182, not 920/1,753. Of the 262 incorrect forecasts, 159 reached the opposite side first and 103 reached no eligible pool before the window ended. None reached the predicted side first but a different pool. An abstention means the probability and margin rules were not met; it is not itself a forecast that no pool would be reached.
For this separate three-class scoring convention, each abstention is scored as NONE. The resulting 62.58% does not measure the cost of abstaining.
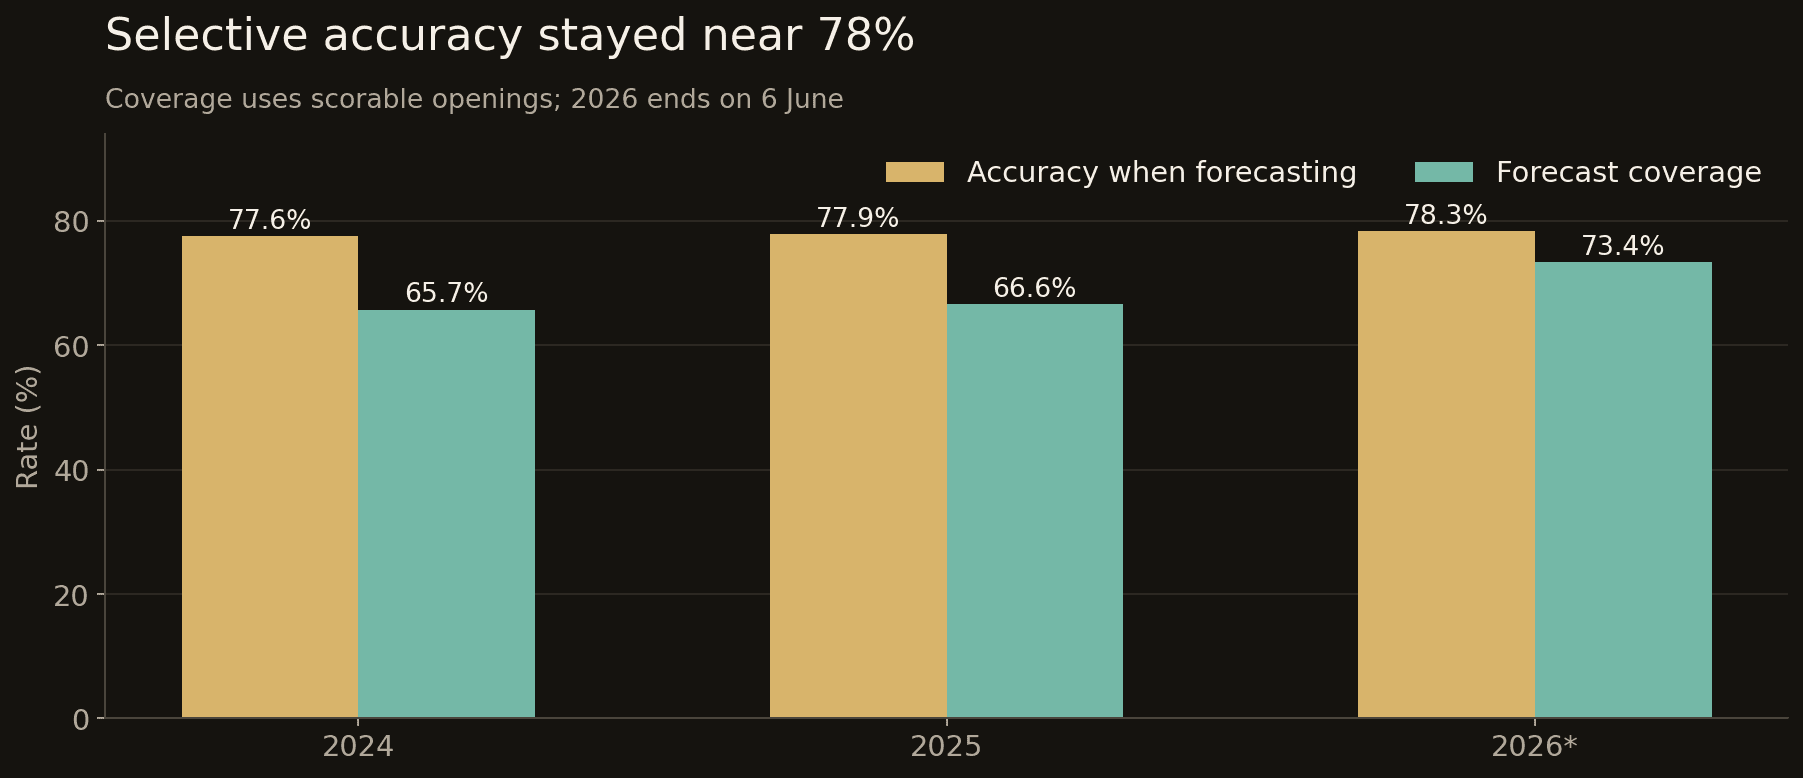
The selective result was similar in each confirmation year: 77.57% in 2024, 77.87% in 2025 and 78.32% through 6 June 2026. Coverage was 65.70%, 66.62% and 73.38%, respectively. The final year is incomplete.
The time of day changes the coverage
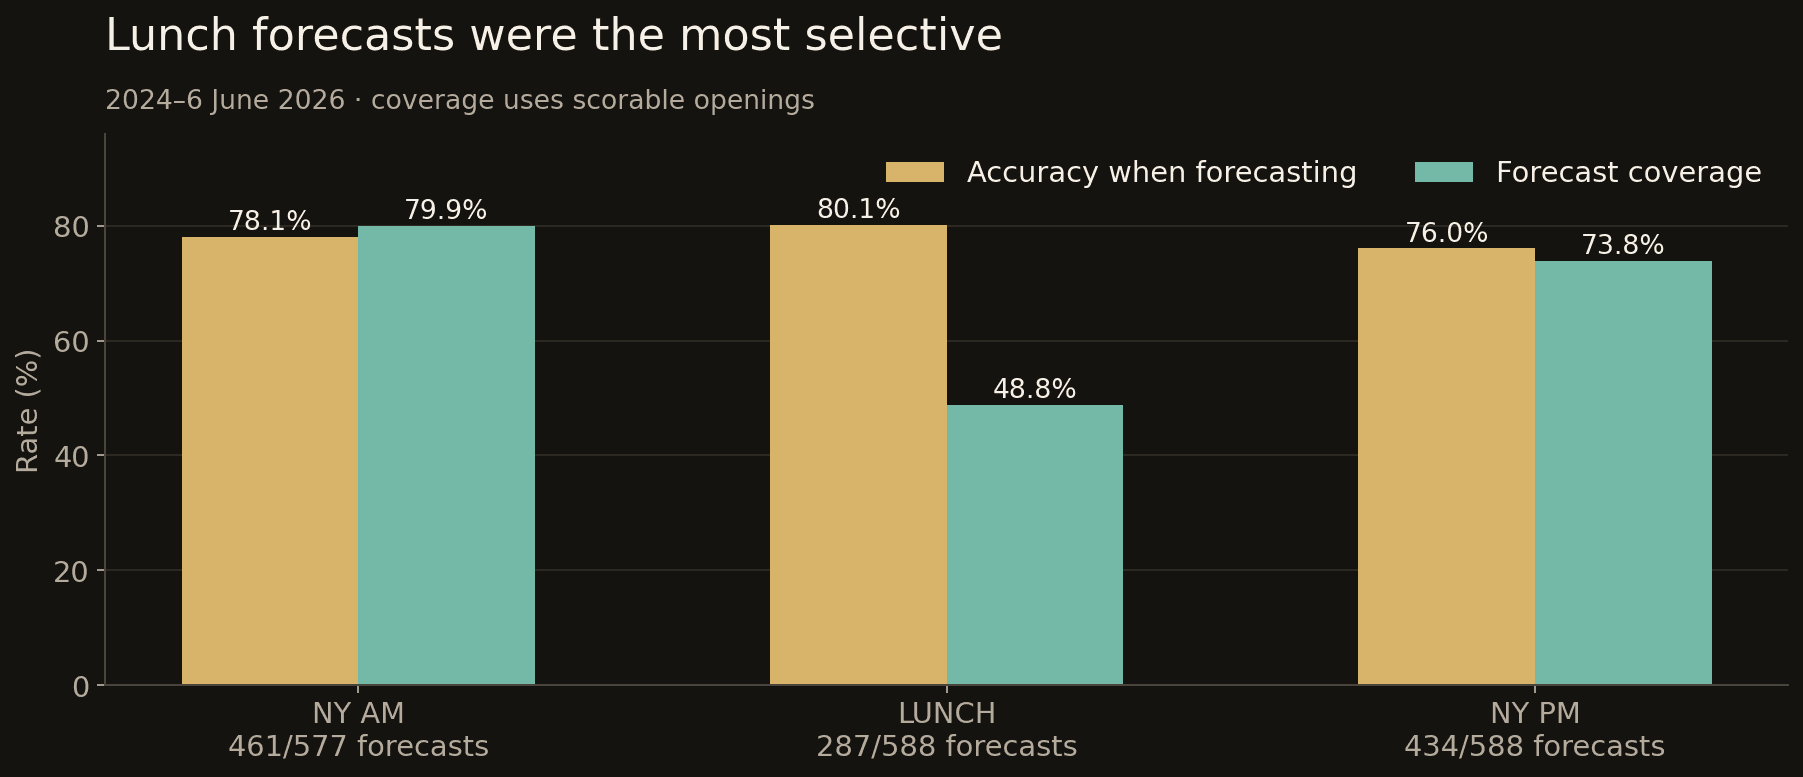
The model did not forecast equally often in all three windows. In the scorable confirmation subset it issued a direction for 461 of 577 NY AM openings, 287 of 588 Lunch openings, and 434 of 588 NY PM openings. Their respective accuracies were 78.09%, 80.14% and 76.04%.
Lunch therefore has the highest observed accuracy among issued forecasts, but also the lowest coverage: 48.81%. Calling Lunch the “best” window based on accuracy alone would ignore that the procedure declined to forecast on more than half its scorable openings. NY AM coverage was 79.90%; NY PM coverage was 73.81%.
What does the model add beyond proximity?
The nearest-active-pool control exposes the limit of the headline result. On the same 1,182 openings accepted by the model, it was correct on 920. Paired event by event, both methods were correct 913 times and both were wrong 255 times. The model alone was right seven times; nearest alone was right seven times.
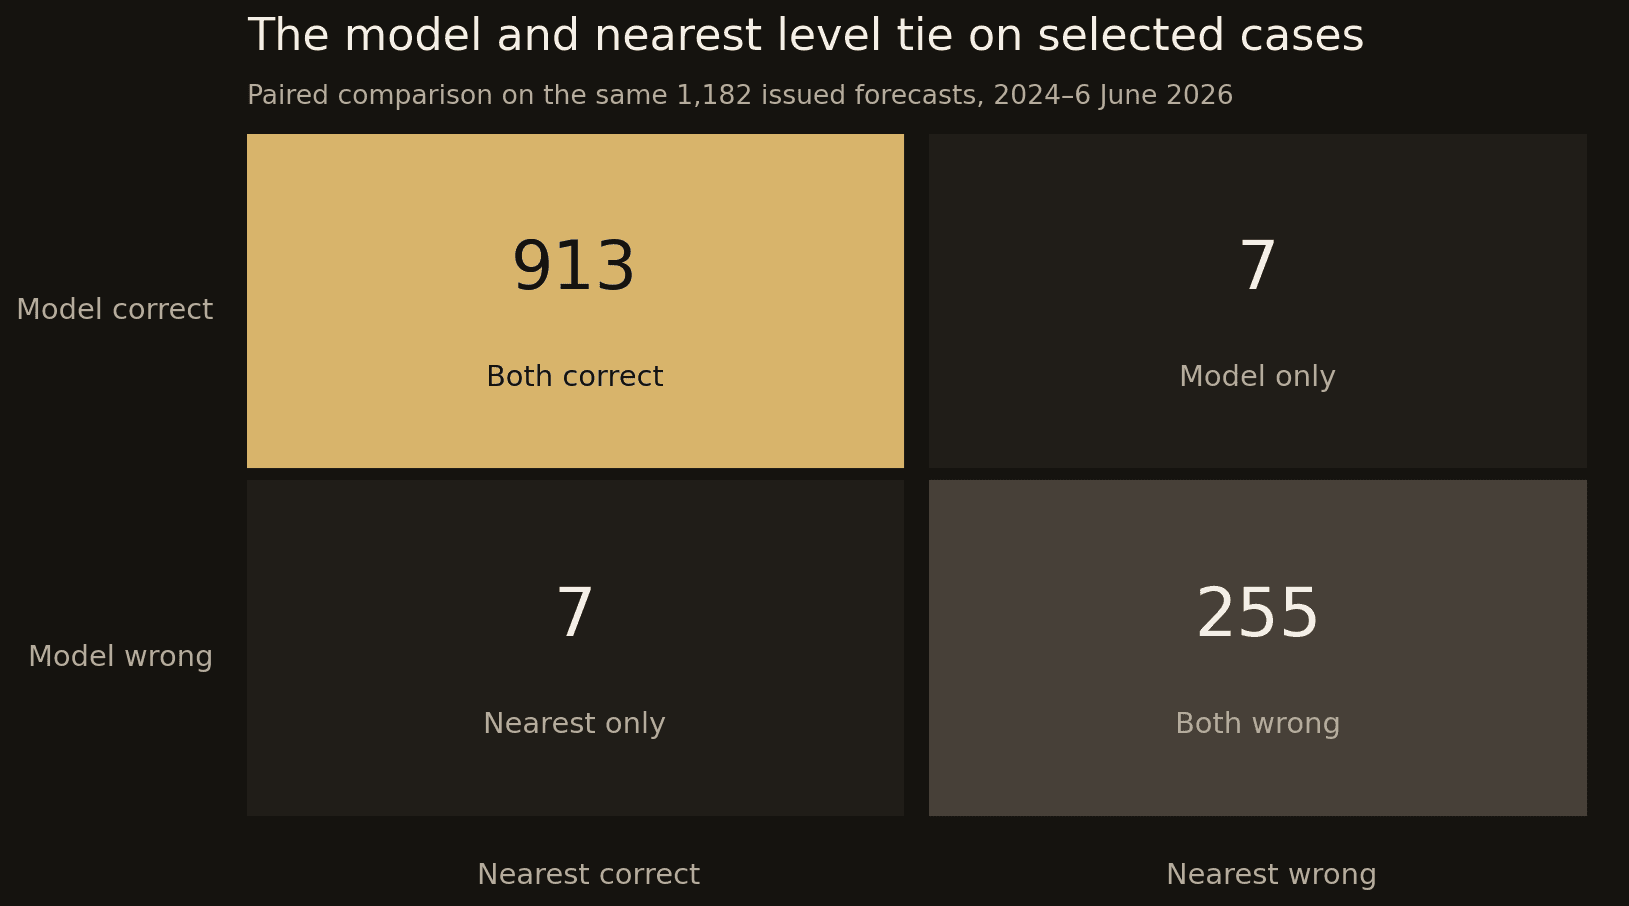
If the nearest rule is forced to choose on all 1,753 scorable openings, it identifies the first pool on 1,188: 67.77%. That number cannot be directly set against the model’s 77.83%, because the model’s percentage excludes 571 scorable openings. The matched 1,182-event comparison is the relevant test of target ranking. It is a tie.
The probability threshold and margin selected a subset in which the nearest active level more often came first. A simpler filter based only on distance has not been tested at the same coverage, so we cannot attribute that selection to the model's additional features. This study does not show that the model can distinguish nearby pools of the same side better than the simple distance rule.
What remains unknown
The target and horizon are deliberately narrow. A pool reached in Lunch after an NY AM forecast expired counts as not reached within NY AM, even though the level was reached later that day. The experiment does not resolve whether carrying that original target across windows would improve forecasting. It also does not measure the order of every intervening sweep, how far price moves against the target before reaching it, or when a target should be replaced. Those are separate questions, not corrections to this window-defined result.
One-minute OHLC bars cannot identify which of two touched levels came first inside the same bar. The 79 ambiguous same-side first touches were excluded from the exact-target comparison rather than assigned a favorable order. The exclusion rule was fixed in advance, but whether a window is excluded is determined by its later price path. Accuracy and coverage therefore apply to the retrospectively scorable subset, not to every constructed window or to live openings generally. No model forecasts were retained for the 79 excluded windows. Continuous-contract changes, inactive levels and incomplete required data further restrict the population. The historical confirmation periods are chronological, but they are not fully untouched because this market and some of these data were studied before the frozen run.
The result supports a precise statement: in the scorable, forecasted New York windows of this retrospective sample, the procedure often identified the first active liquidity pool reached before that window ended. It does not establish an advantage over selecting the nearest active pool on those same events. A different question—whether a target should persist and change dynamically across the trading day—belongs to a separate study.
Updated September 30, 2026: added the historical data source to the methodology.
For questions, feedback, or further information about these studies, contact research@thehermestrader.com.
Related articles
NQ Weekly Profile Research: What 16 Years of Data Reveals
An empirical study of 769 non-roll NQ weeks maps when weekly extremes form, which price paths recur, and what Friday's close suggests about the following week.
ICT Macros in NQ: When Hourly Moves Begin
An empirical study of NQ hourly origins, timing boundaries, session context and closing windows, separating recurring price structure from predictive value.
NQ Overnight Returns: Historical Drift, Execution Costs and Capital Requirements
An NQ overnight-return study covering 2010–2025, with MNQ execution, risk and capital estimates. The selected rules failed internal validation; their partial 2026 results do not establish a stable net edge.